
Swing trading is a popular trading strategy that involves capitalizing on short-to-medium-term price movements in the financial markets. By combining technical analysis tools like Volume Profile charts, traders can gain a deeper understanding of price dynamics, enabling them to make informed decisions. Swing Trading with Volume Profile helps traders identify high-probability trade setups by revealing key areas of support, resistance, and market participation.
In this guide, we’ll uncover how to master Swing Trading with Volume Profile charts, offering actionable steps and expert tips to elevate your trading strategy. Whether you’re a beginner trader or an experienced trader, integrating Volume Profile into your swing trading approach can provide a significant edge.
What Is Volume Profile, and Why Does It Matter?

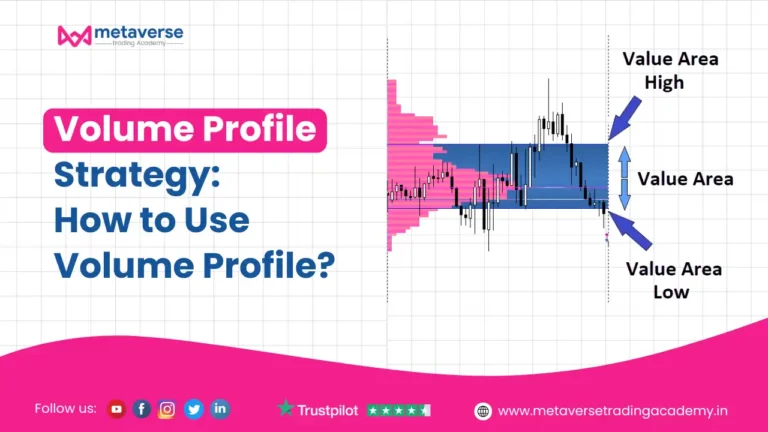
Volume Profile is a powerful technical analysis tool that displays trading volume at various price levels over a specific period. Unlike traditional volume indicators, which track total volume, Volume Profile pinpoints price levels where buyers and sellers are most active.
Key Benefits of Using Volume Profile in Swing Trading
- Identifies Value Areas: Helps pinpoint areas of high trading activity, revealing where the market sees fair value.
- Highlights Support and Resistance Zones: Shows price levels where reversals or breakouts are likely.
- Confirms Trend Strength: Allows traders to assess whether volume supports the prevailing trend.
By integrating Volume Profile with swing trading, you can identify strategic entry and exit points, manage risks effectively, and improve overall profitability.

Step-by-Step Guide to Swing Trading with Volume Profile
1. Master the Basics of Volume Profile
Before applying Volume Profile, it’s essential to understand its core components:
- Point of Control (POC): The price level with the highest traded volume.
- High Volume Nodes (HVNs): Areas with concentrated trading activity, indicating strong support or resistance.
- Low Volume Nodes (LVNs): Zones with minimal activity, often signaling potential breakout points.
- Value Area (VA): The price range where 70% of trading volume occurs.

Actionable Tips:
- Use a demo trading account to practice identifying these features on live charts.
- Familiarize yourself with the Volume Profile indicator settings in your preferred trading platform (e.g., TradingView, Thinkorswim).
2. Identify Key Levels for Swing Trades
Once you’re comfortable reading Volume Profile charts, start identifying critical levels for trading:
- Support and Resistance Zones: HVNs often act as strong support or resistance. Monitor these levels for price reactions.
- Breakout Opportunities: LVNs typically signal low resistance, making them ideal for capturing breakout trades.
- Reversal Areas: The POC can act as a pivot point where trends may reverse or accelerate.
How to Apply This in Swing Trading:
- Analyze the recent price action using Volume Profile to locate HVNs and LVNs.
- Use these levels to set up buy or sell orders near anticipated turning points.
- Combine with additional indicators (like RSI or MACD) for confirmation.
3. Time Your Trades Using Volume Profile
Swing trading requires precise timing, and Volume Profile is invaluable in determining when to enter or exit:
- Volume Confirmation: Ensure significant volume aligns with your trade direction for higher confidence.
- Wait for Retests: After a breakout from an LVN, wait for the price to retest the level before entering.
- Monitor Value Area Transitions: If the price moves out of the Value Area, expect a potential trend continuation.
Pro Tips for Timing:
- Look for volume spikes at key levels to validate trade setups.
- Avoid entering trades during low-volume periods, like pre-market hours.
4. Manage Risk with Volume Profile
Effective risk management is crucial for long-term success in swing trading. Volume Profile can help you:
- Set Stop-Loss Levels: Place stops just beyond LVNs to reduce risk of false breakouts.
- Define Profit Targets: Use HVNs as logical profit-taking zones, as prices often consolidate there.
- Adjust Position Sizing: Trade smaller positions when price is near LVNs due to higher volatility risk.
Risk Management Checklist:
- Identify both your stop-loss and target before entering a trade.
- Use the POC as a reference to adjust your trade size and risk.
- Regularly review your trades to refine your Volume Profile strategy.

Combining Volume Profile with Other Tools
While Volume Profile is powerful, combining it with other analysis methods can further enhance your strategy:
- Moving Averages: Use them to confirm trend direction and strength.
- Fibonacci Retracements: Align Fibonacci levels with HVNs for robust support or resistance areas.
- Price Action: Monitor candlestick patterns around Volume Profile levels for additional insights.
Common Mistakes to Avoid
- Ignoring the Bigger Picture: Always consider higher timeframes when analyzing Volume Profile levels.
- Overtrading LVNs: Low-volume zones can lead to choppy price action; trade them selectively.
- Neglecting Risk Management: Avoid oversized positions, especially near volatile zones.

Conclusion: Unlock Your Trading Edge with Volume Profile
Swing Trading with Volume Profile is a game-changer for traders seeking consistent results. By mastering Volume Profile’s unique insights into market activity, you can identify high-probability setups, manage risk effectively, and achieve better timing for entries and exits.
Start by practicing the basics of Volume Profile, then integrate it into your swing trading strategy with the actionable steps provided. As you refine your skills, you’ll unlock the potential to trade with greater confidence and precision.
Ready to elevate your trading game? Begin exploring the power of Volume profile & Market Profile today and take control of your swing trading journey!
If you want to take your learning further, join Metaverse Trading Academy, where more than 50,000 students have already learned advanced strategies like Order Flow and Market Profile trading. Start your journey today at metaversetradingacademy.in.

Vikas Gahlot
NISM-certified trader, technical analyst, and founder of Metaverse Trading Academy. With more than 10 years of experience in stock market trading and technical analysis, I have trained over 10,000 students across India through online and offline trading programs focused on intraday trading, swing trading, futures & options, and risk management.
More guides by Vikas Gahlot →