CLBS V18 · Private Edition 2026

Learn Trading with the Best Trading Academy in India

Learn Trading with the Best Trading Academy in India using All Institutional Tools (Order Flow, Market Profile, Volume Profile, Option Chain Analysis, VWAP Theory, and Delta Secret)

New: CLBS V18. 45-day guided path, 4 live sessions a day, 2 books + AI co-pilot.

Our Mentorship Plan
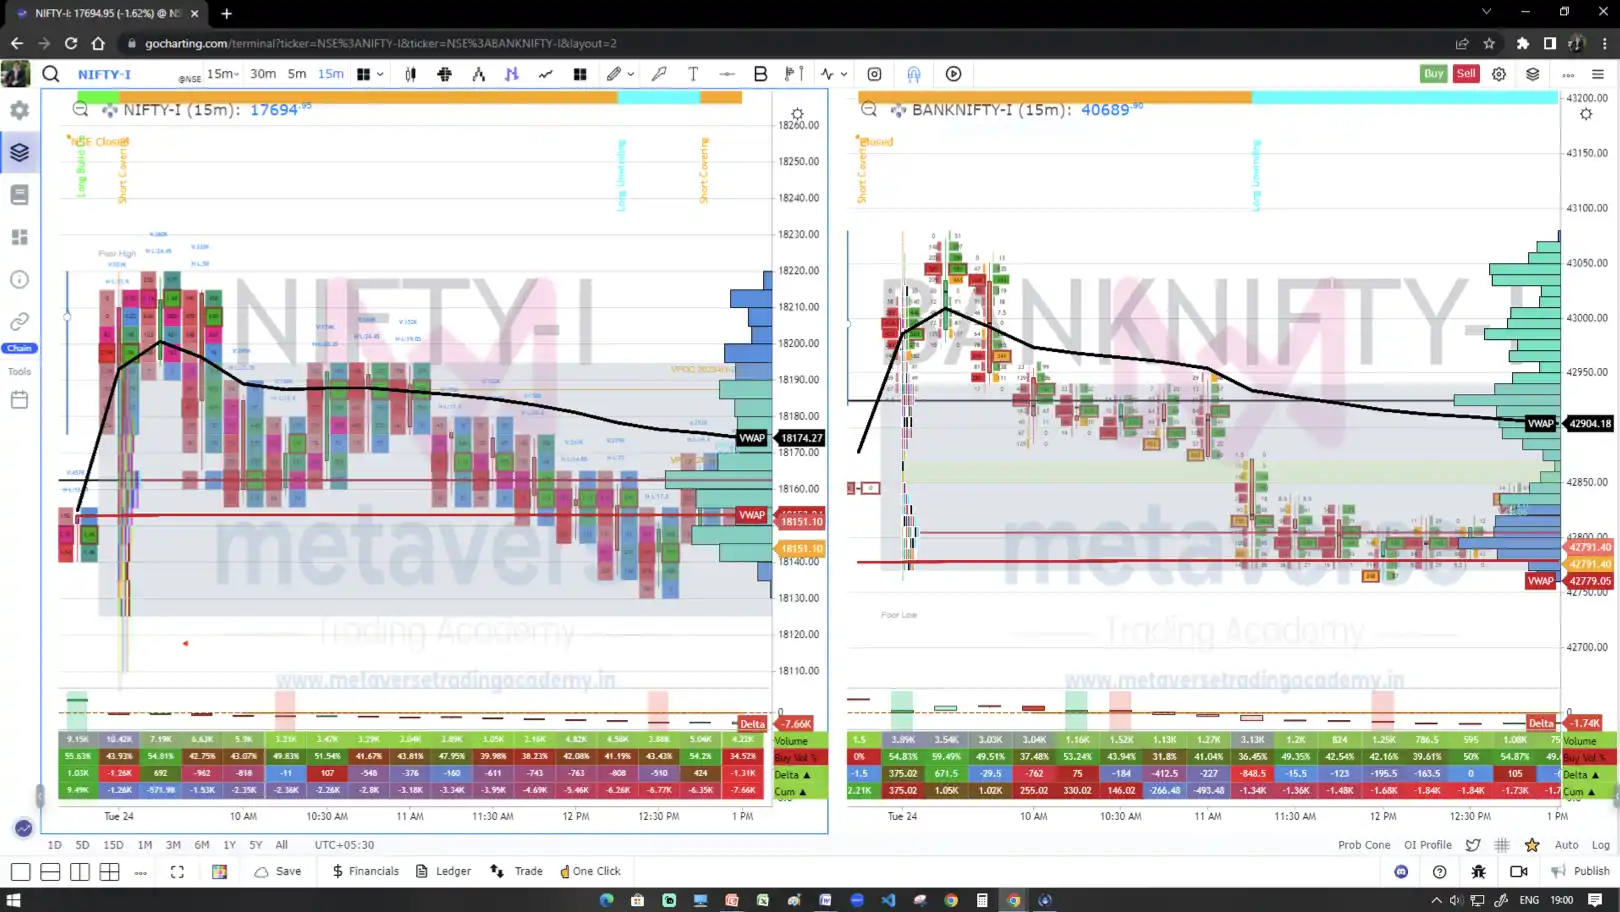
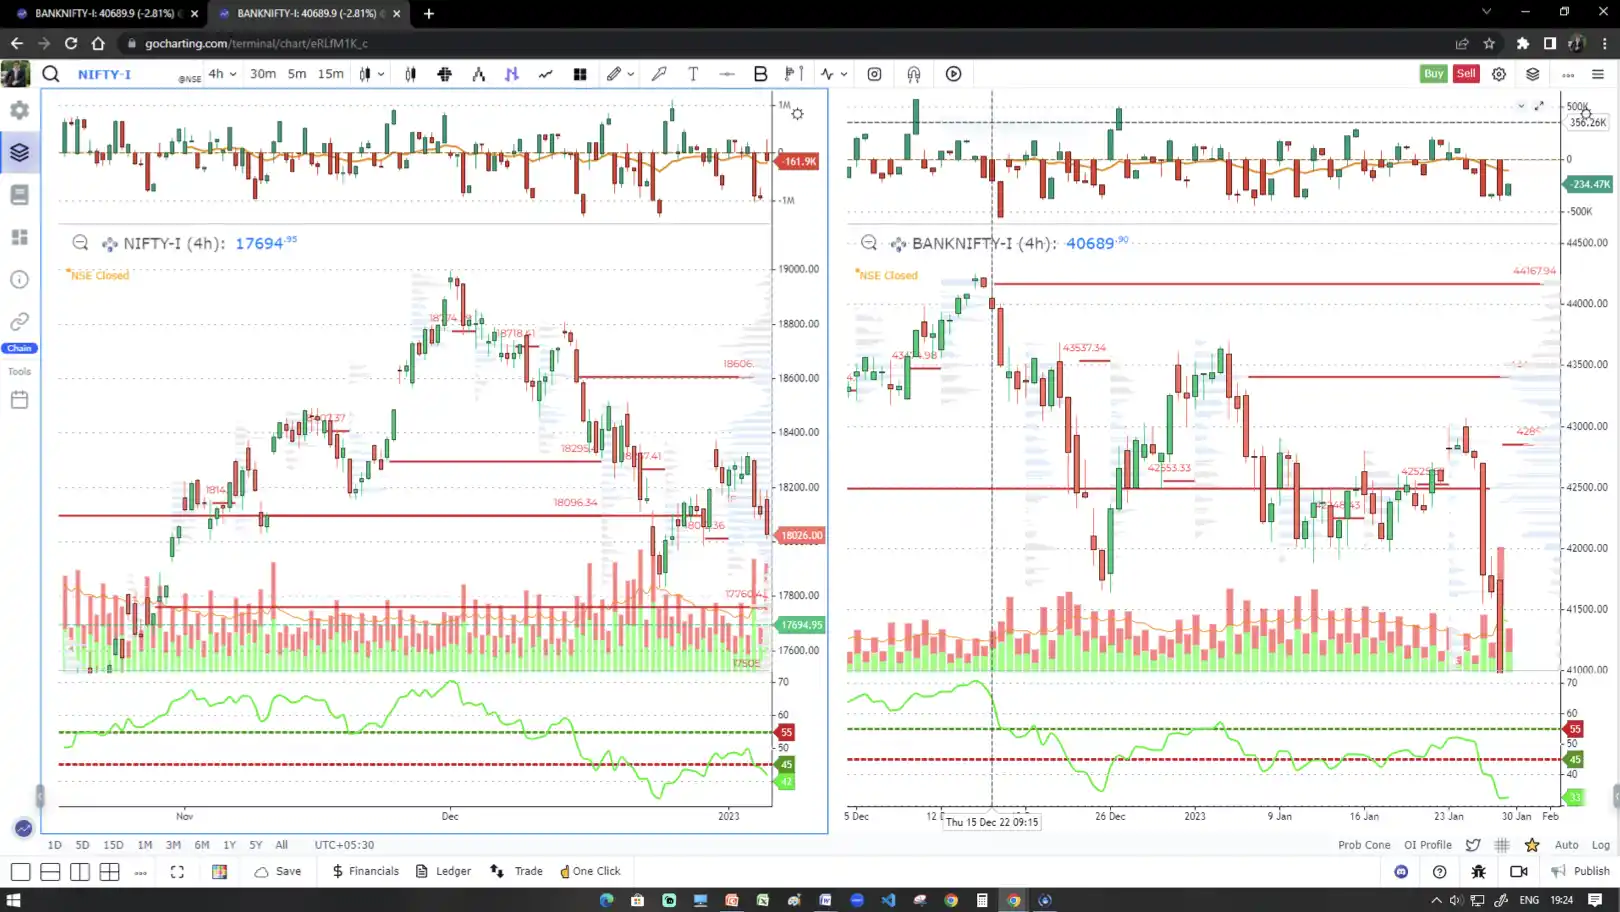
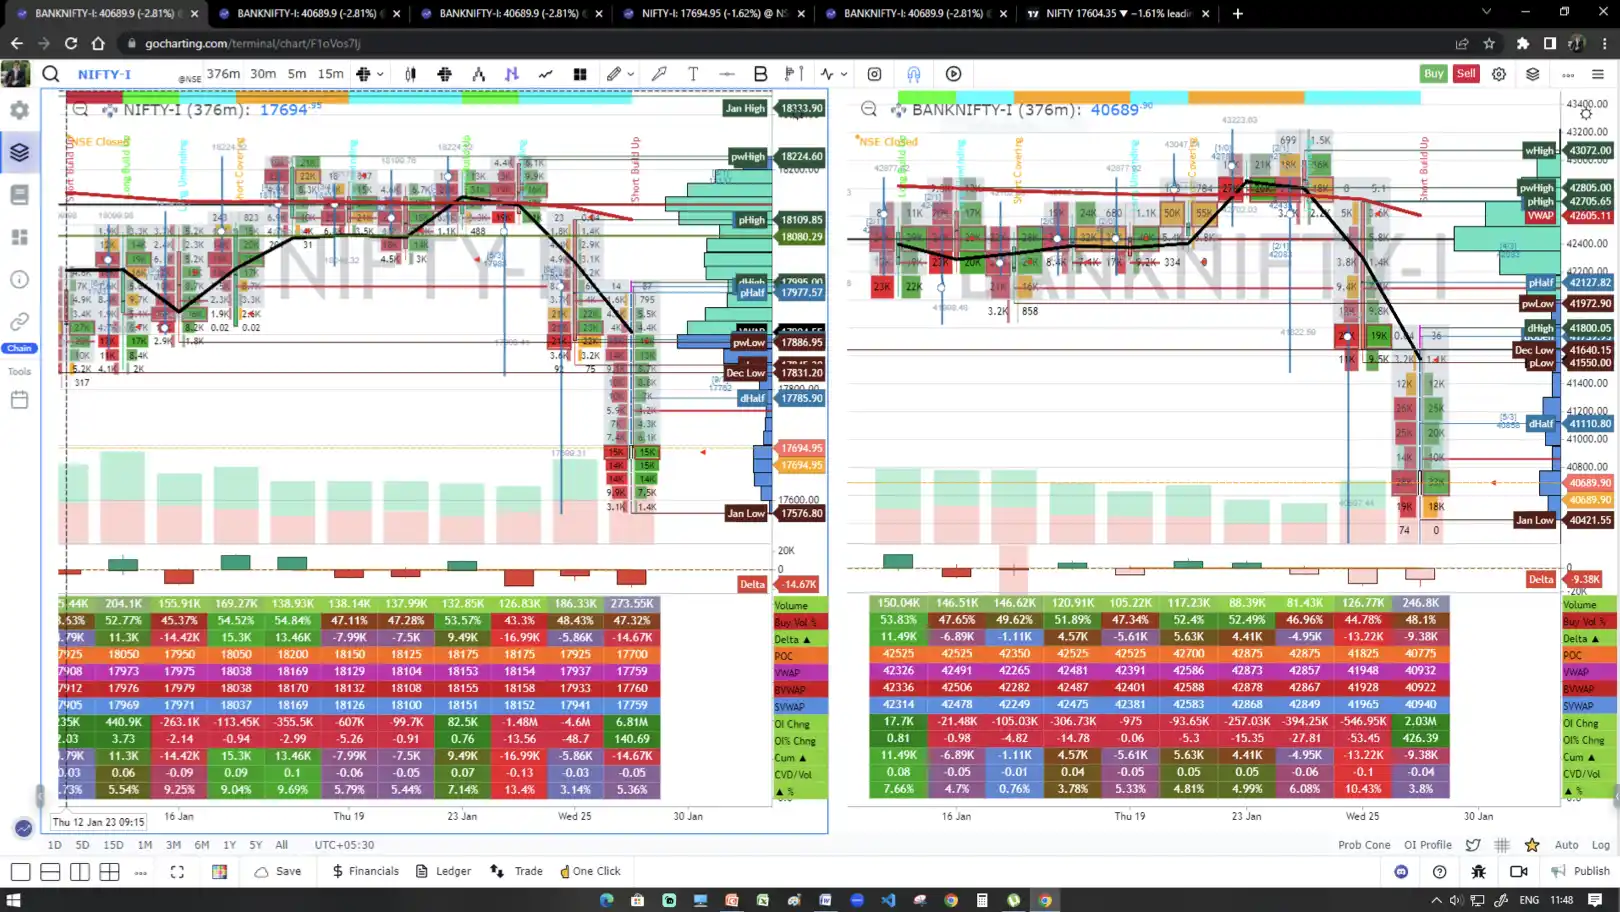
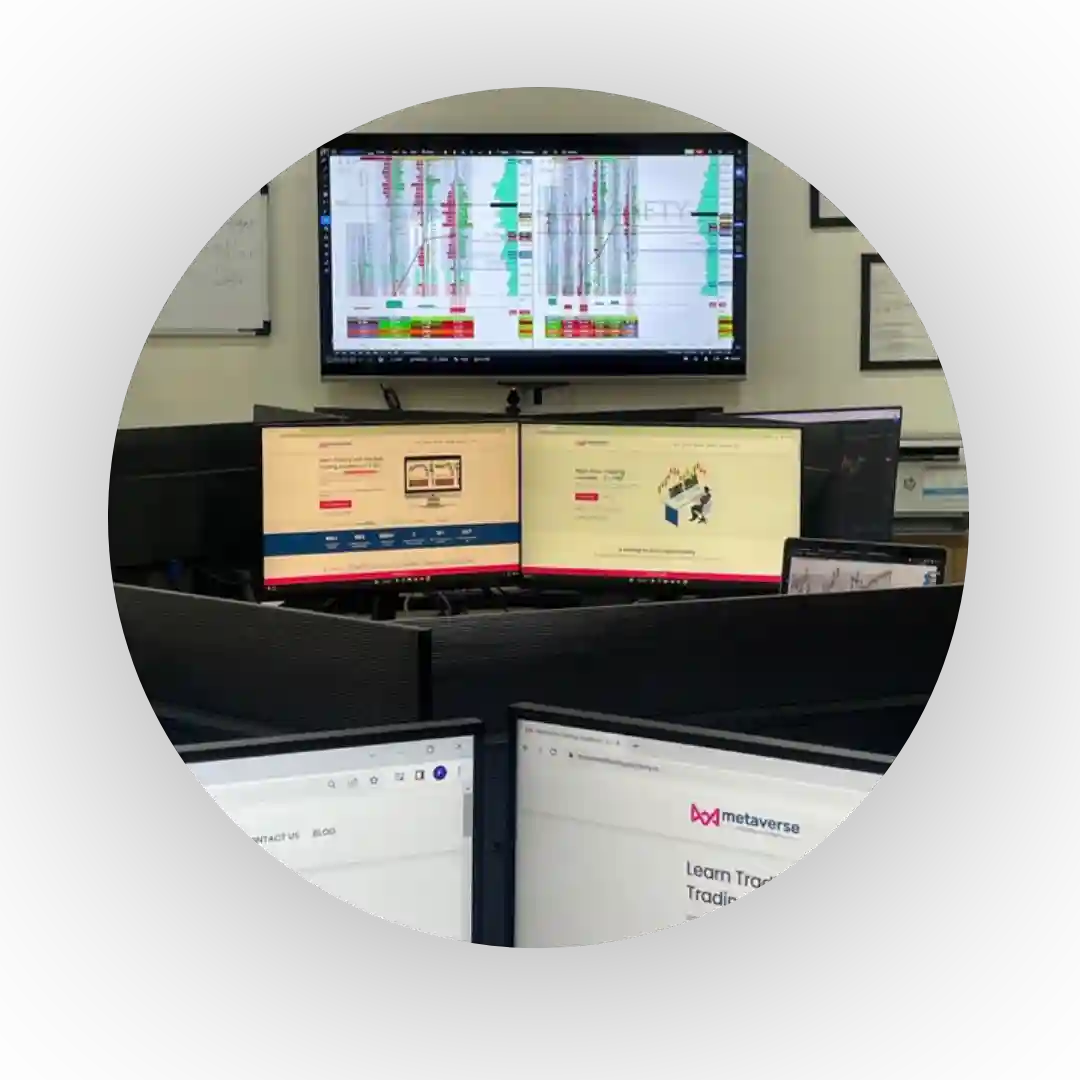
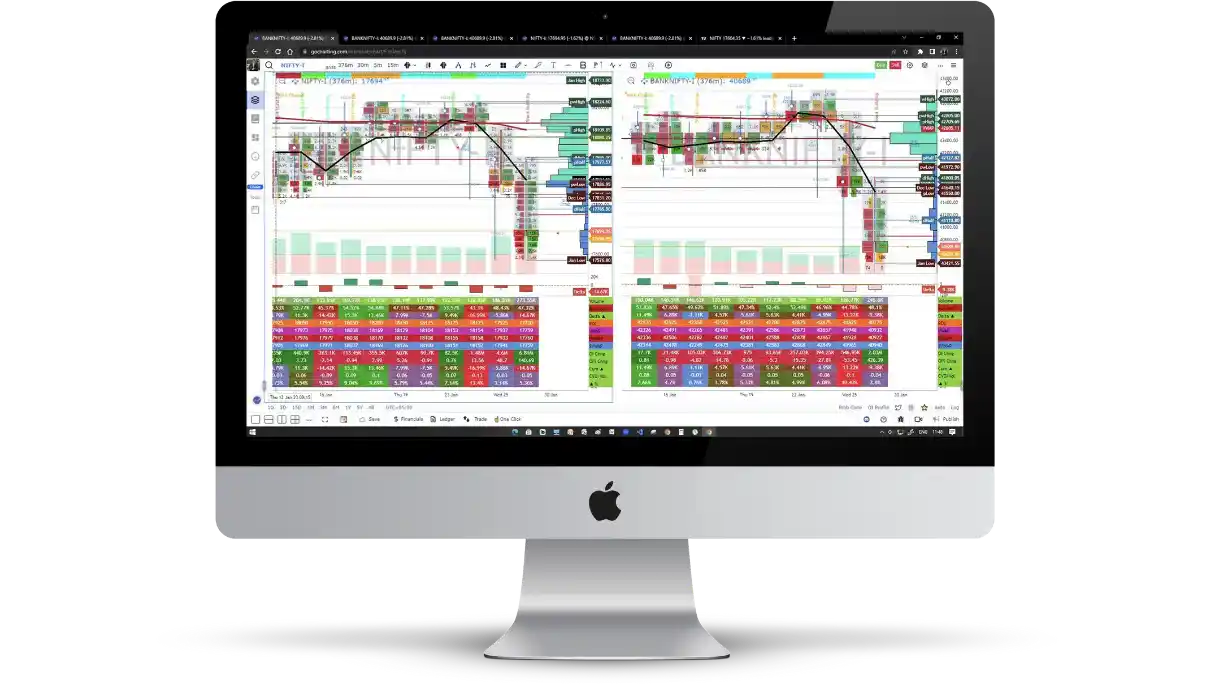
Live order flow and market profile charts at Metaverse Trading Academy
LIVE · 4 sessions every market day
45-Day Guided Path
Vikas Gahlot
Vikas GahlotFounder & Chief Mentor · 20+ years
★★★★★ 4.6 · 200+ reviews

Our Students Say Excellentmetaverse review

4.6 out of 5 based on 200+ reviews

95%+

trade and signal
accuracy

80K+

Instagram Followers & Users

15000+

traders around
the globe

20,000+

YouTube Channel Subscribers

35k+

Telegram Community Members

20+

Years of Experience in Market

The tools you'll master

Your professional toolkit.

The same institutional tools we have always taught: order flow, market profile, volume profile, option chain and VWAP. Now joined into one read.

POC

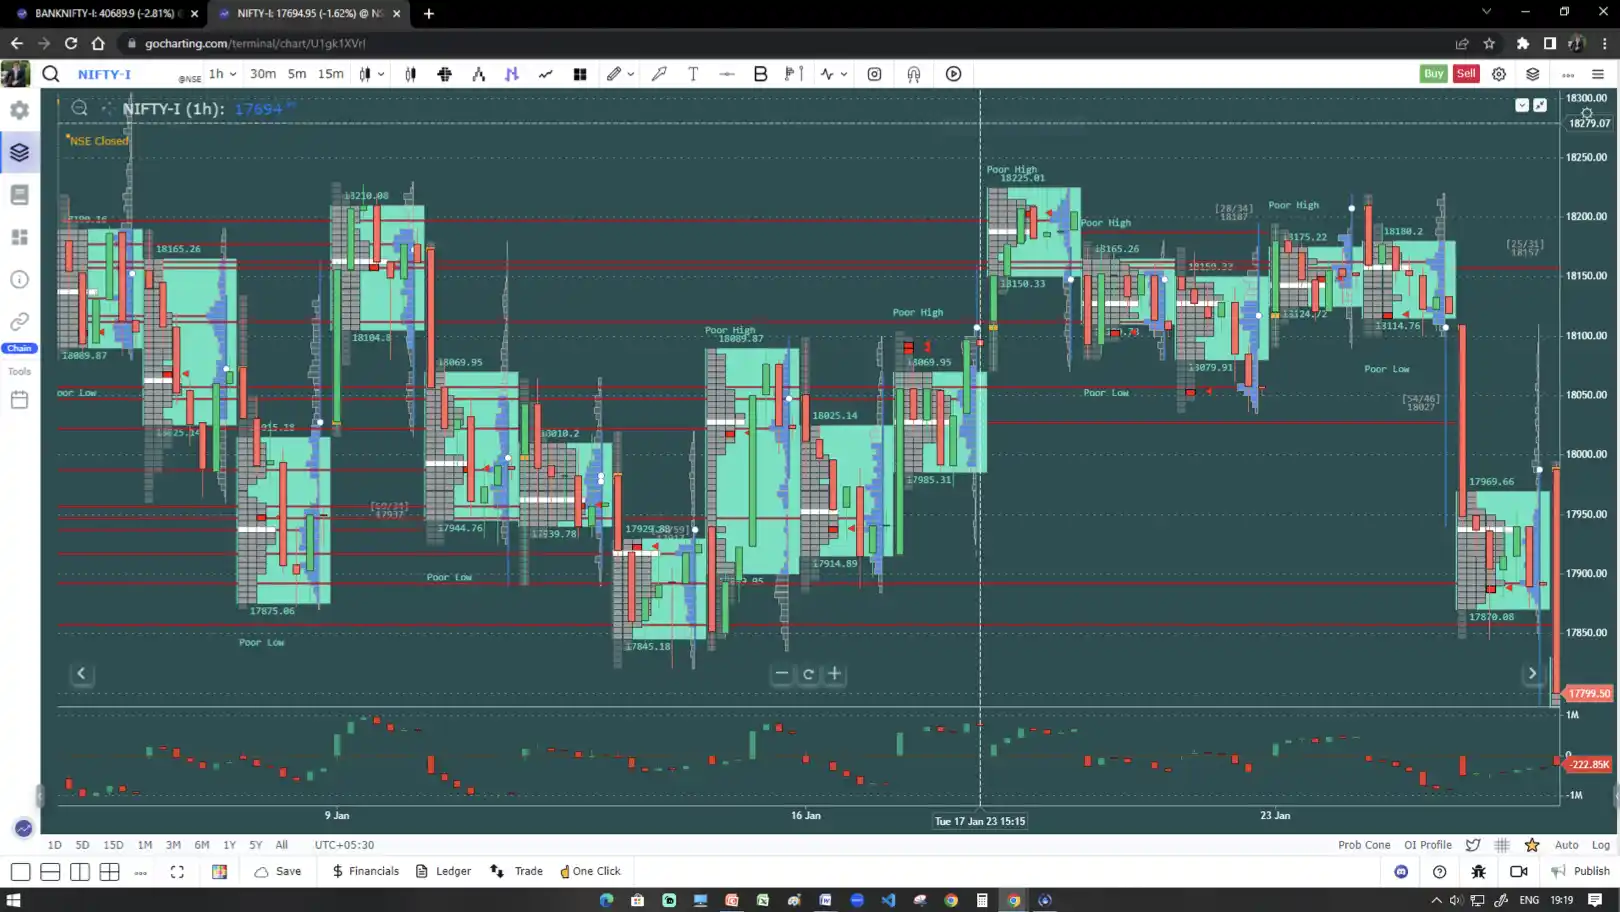
Market & Volume Profile

See where the market accepted value, and where it rejected price.

VWAP

VWAP & fair value

Know if price is expensive, cheap or fair, from intraday to monthly.

Footprint & order flow

Watch real buying and selling inside every candle, level by level.

CALL OIPUT OI

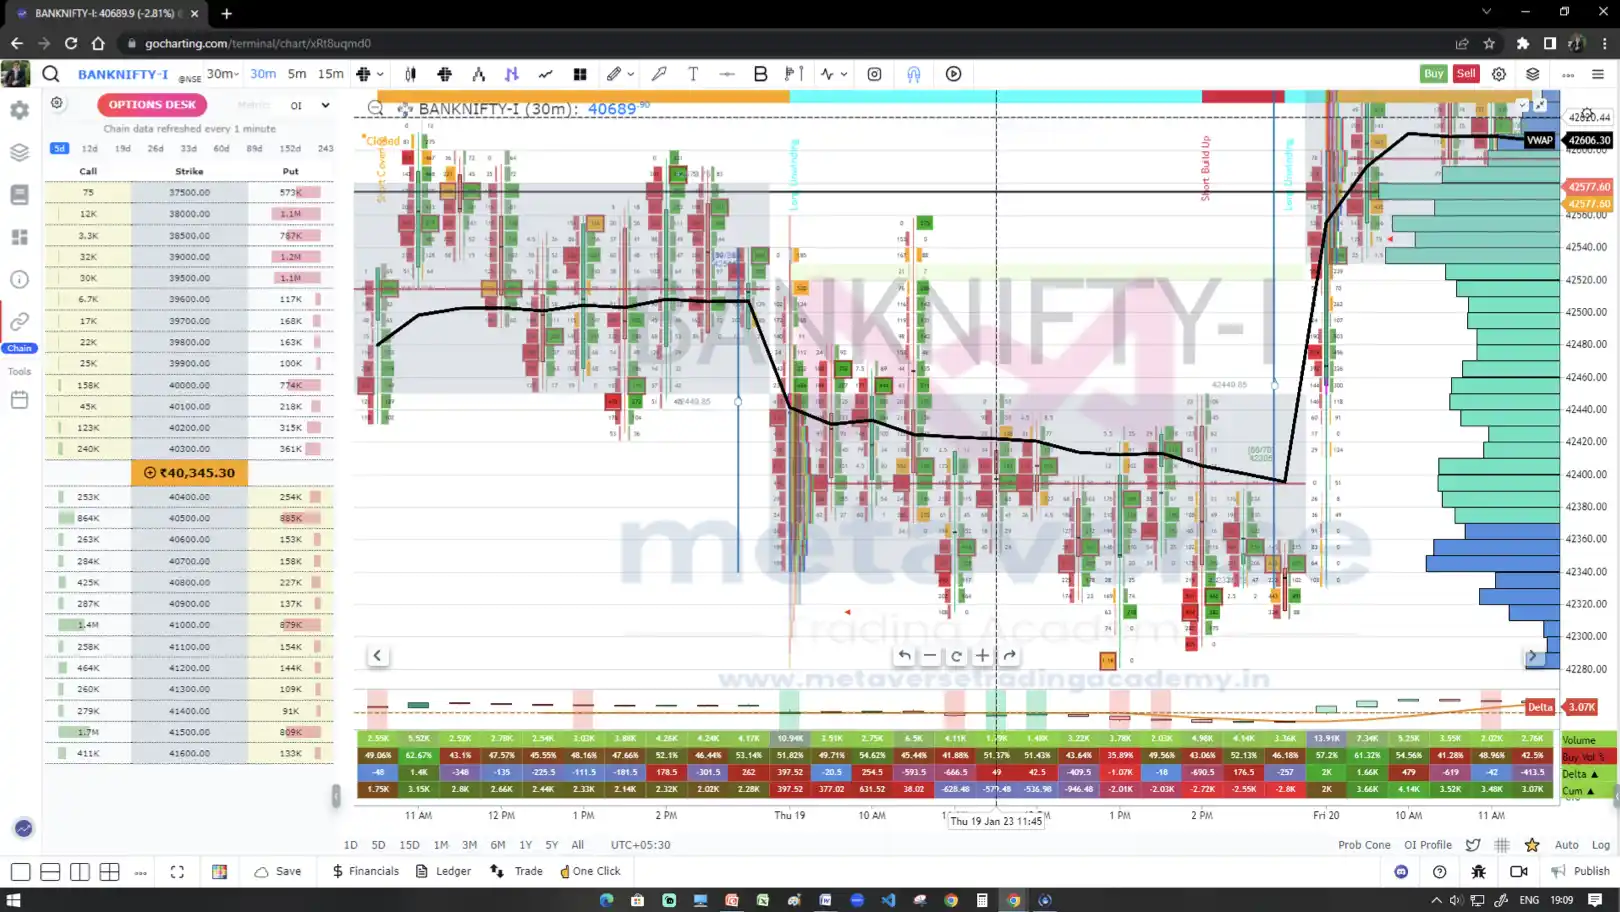
Option chain & OI

Read where positions are built, defended or abandoned.

Δ Γ Θ νIV SKEW

Greeks, IV & hidden Greeks

Delta, Gamma, Theta, Vega, plus approximated hidden Greeks: Vanna, Charm, Volga, Veta.

GAMMA FLIP

Dealer positioning (GEX)

Spot when markets tend to stay calm, and when moves can speed up.

+ AI co-pilotbrings every tool together into one clear read: Context, Levels, Bias and Strategy. Works with Claude, ChatGPT or Gemini, in the language you think in.
CLBS V18 brochure cover, Metaverse Trading Academy
Free download · 20 pages · PDF

Get the full CLBS V18 brochure.

Everything about the programme in one place. Read it, share it with family, then message us with your questions.

  • The CLBS shift: before and after
  • The five-step CLBS engine
  • Your professional toolkit
  • Reading the dealer, not the noise
  • Option sellers and price action traders
  • The 45-day path and live schedule
  • Two books + AI co-pilot
  • Fact sheet and FAQs
Download CLBS V18 BrochureWhatsApp us

PDF, 2.3 MB. No sign-up needed.

The CLBS knowledge engine

From data to decisions.

Two complementary books. One structured workflow. Independent thinking, in any market and any language.

BOOK I
CLBS
V18 Pro
THE DOCTRINE
104 PAGES

Institutional AI Prompt Book

How to think.

  • Evidence rules for every data point
  • OI, Greeks and dealer positioning
  • Auction, profile, VWAP, footprint
  • Buyer, seller, stand-down routes
  • Adapters for India, US, gold, crypto
BOOK II
CLBS
V18 Pro
THE PRACTICE
64 PAGES

Student Operator Manual

What to do, every day.

  • AI and screen setup, clean data
  • Live day: pre-open to post-close
  • Scalp, swing, options and investing
  • Risk sizing and emotion control
  • A 10-minute drill on every page
01Load both books
Into any capable AI
02Run intake check
It verifies your data first
03Get your verdict
Permission, Restriction or Stand-Down

The results speak for themselves, see our reviews below.

Trading Experience at Metaverse Academy

Joining Metaverse Academy four months ago was a fantastic decision. Vikas Sir and Sagar Sir provide excellent guidance in daily classes, helping me clarify doubts and gain confidence in market movements. I’m thoroughly enjoying my learning experience!

Outstanding Support from Vikas Sir

Vikas Sir is truly awesome! His effective strategies and live trading sessions have been invaluable in helping me develop a fearless trading psychology. With his support during live sessions, I feel much more confident entering trades and holding them for greater profits.

Exceptional Learning at Metaverse

My experience with Metaverse has been excellent since day one. The classes offer individual guidance to ensure I fully understand the concepts. Vikas and Sagar Sir provide exceptional knowledge and reliable calls. Thanks to their support, I’ve recovered most of my losses.

Learn the tools

Institutional tools, explained.

Pick a tool to see what it shows and how institutional traders use it.

1. Which trading tools are used by institutional traders?

Institutional traders use a variety of tools to make trading decisions and manage risk. Some of the most common tools used by institutional traders include:

  • Trading platforms: Institutional traders use advanced trading platforms, such as Bloomberg and Reuters, to access real-time market data, execute trades, and manage risk. These platforms are often tailored to support techniques like Order Flow Trading, which helps traders analyze market depth and trends effectively.
  • Algorithmic trading systems: Institutional traders use sophisticated algorithmic trading systems to automatically execute trades based on pre-set rules and conditions. These systems often integrate methods like Market Profile and Volume Profile analysis to refine execution strategies.
  • Market data and analytics: Institutional traders rely heavily on market data and analytics to make informed trading decisions. This includes tools such as charting software, order flow trading analysis, and advanced techniques like Market Profile and Volume Profile, which provide insights into price action and market behavior.
  • Risk management tools: Institutional traders use risk management tools to manage the risk of their trades. This includes tools such as stop loss orders, position sizing, and portfolio optimization, which are particularly vital for strategies employed in the Best Trading Academy in India, known for its emphasis on risk management in Order Flow Trading.
  • Compliance and surveillance tools: Institutional traders use compliance and surveillance tools to ensure they are following regulations and laws. This includes tools such as trade monitoring and surveillance systems and compliance reporting software.
  • Networking and communication tools: Institutional traders use networking and communication tools to stay connected with other traders, analysts, and industry professionals. This includes tools such as instant messaging and email, which are often complemented by platforms that support Volume Profile and Market Profile insights.
  • Machine learning and AI: Institutional traders have been increasingly using machine learning and AI to make more informed trading decisions and to process large amounts of data more effectively. These advanced technologies are integral to the training provided by the Best Trading Academy in India, which teaches traders to harness AI and ML for better decision-making.

It’s worth noting that institutional traders often use a combination of these tools and may also use additional tools that are specific to their trading strategies and the markets they trade-in. Techniques like Market Profile, Volume Profile, and Order Flow Trading play a significant role in shaping strategies, making these tools indispensable for professional traders.

2. What is order flow trading?

Order flow trading is a type of trading strategy that involves analyzing the flow of orders for a financial instrument to predict future price movements. It is based on the idea that the order flow, or the number and size of buy and sell orders, can indicate market sentiment and reveal information about future market conditions.

Traders who use order flow trading strategies typically focus on analyzing the order book, which is a record of all buy and sell orders for a financial instrument. They may also use other tools such as volume profile, auction market theory, and footprint charts to help them understand the order flow. Techniques like market profile also play a crucial role in interpreting market behavior and identifying potential trading opportunities.

Order flow traders often focus on short-term trades and use real-time data to make decisions. The strategy is commonly used in futures, forex, and equities markets but can be applied to other markets as well. Many traders learn these advanced techniques, including order flow trading, volume profile, and market profile, through expert guidance provided by the best trading academy in India.

It is important to note that order flow trading requires a high level of technical expertise and can be complex and challenging, making it unsuitable for every trader. It is essential for traders to have a solid understanding of market dynamics, technical analysis, and risk management before attempting to use order flow trading strategies. Training from the best trading academy in India can provide valuable insights and skills needed to master this sophisticated trading approach.

3. What is the market profile?

Market profile is a type of charting method that was developed by J. Peter Steidlmayer in the early 1980s. It is based on the idea that the price and time of a financial instrument can provide insight into the buying and selling activity of market participants and can be used to predict future price movements.

The market profile chart is a graphical representation of the trading activity for a particular financial instrument during a specific time period. It is divided into vertical “time price opportunities” (TPOs), which are horizontal blocks that represent a specific price range. The height of each TPO represents the volume of trades that occurred within that price range during a given time period. Techniques like volume profile are often used in conjunction with market profile to provide a more comprehensive view of trading activity.

Traders typically use the market profile chart to identify key levels of support and resistance, as well as areas of value and control. It can also be used to analyze trends and patterns in trading activity, helping traders anticipate future price movements. Strategies such as order flow trading can further enhance the insights gained from market profile charts, making it a valuable tool for experienced traders.

It is important to note that market profile trading is a complex strategy that requires a high level of technical expertise and experience. Aspiring traders often learn to master these techniques, including order flow trading and volume profile analysis, by enrolling in the best trading academy in India. Such training provides a solid foundation in market dynamics and technical analysis, enabling traders to effectively use market profile trading strategies.

4. what is the volume profile?

Volume profile is a charting method that uses volume data to provide insight into the buying and selling activity of market participants. It is based on the idea that volume, or the number of shares or contracts traded, can indicate market sentiment and reveal information about future market conditions.

The volume profile chart is a graphical representation of the trading activity for a financial instrument during a specific time period. It shows the distribution of volume at different price levels, highlighting areas of support and resistance and the relative importance of different price levels. Traders often combine volume profile with other tools such as order flow trading and market profile to gain a comprehensive understanding of market dynamics.

Traders who use volume profile trading strategies typically focus on analyzing the volume profile of a financial instrument over a specific time period. They may also use tools like order flow analysis and footprint charts to interpret the volume profile effectively.

Using volume profile, traders can identify key levels of support and resistance, as well as areas of value and control. By analyzing trends and patterns in trading activity, they can anticipate future price movements and make informed trading decisions.

It is important to note that volume profile trading is a complex strategy that requires a high level of technical expertise and experience. Many traders gain these skills through structured learning from the best trading academy in India, which specializes in techniques like order flow trading, market profile, and volume profile analysis. A solid understanding of market dynamics, technical analysis, and risk management is essential before attempting to use volume profile trading strategies.

5. Importance of open interest and PCR in option trading?

Open interest and PCR (Put-Call Ratio) are important indicators in option trading as they provide information about the market sentiment and the level of trading activity in the market. These indicators are often used in conjunction with advanced strategies like order flow trading and tools such as market profile and volume profile to gain deeper insights.

  • Open Interest: In option trading, open interest refers to the number of outstanding contracts that have not been exercised or closed. It is a measure of the liquidity of the options market and the level of trading activity. An increase in open interest indicates more trading activity in the market, while a decrease in open interest indicates reduced trading activity. Traders often use open interest to analyze trends and confirm the strength of price movements.
  • PCR: The Put-Call Ratio (PCR) is a popular indicator used to gauge market sentiment in the options market. It is the ratio of the number of put options to the number of call options. A high PCR indicates more puts than calls, suggesting a bearish market sentiment, while a low PCR indicates more calls than puts, suggesting a bullish market sentiment.

Together, open interest and PCR provide valuable insights into market sentiment and trading activity in the options market. These indicators are particularly useful when combined with techniques like volume profile analysis and order flow trading to create a more comprehensive trading strategy.

Traders often learn how to effectively use these indicators and integrate them with strategies like market profile through expert guidance at the best trading academy in India. However, it’s worth noting that these indicators should be used alongside other technical and fundamental analyses to provide a complete market perspective.

6. What is the POC? (Point of Control)

Point of Control (POC) is a concept used in technical analysis to identify the price level at which the most trading activity occurred during a specific time period. It highlights the price level where the market has been most active, serving as an indicator of market sentiment and the balance of supply and demand. Tools like market profile and volume profile are often used to calculate and analyze the POC effectively.

In trading, the point of control can act as a key level of support or resistance. When the market reaches the POC, it is likely to see a reaction from buyers or sellers. If the market trades above the POC, it is considered bullish, while trading below the POC is seen as bearish. Order flow trading strategies often incorporate POC analysis to anticipate market reactions and build trading plans.

The POC can also help identify potential areas for profit-taking or setting stop-loss orders. For instance, when the market is trading near the POC, traders may decide to take profits or place stop-loss orders at that level to safeguard their positions.

It is important to note that the POC is a historical measure and may change as new data and trading activity emerge. Traders often combine the POC with other indicators, such as volume profile, volume point of control, and delta, to form a more comprehensive understanding of market dynamics.

Many traders refine their skills in using tools like POC and strategies such as market profile and order flow trading through structured training provided by the best trading academy in India. Learning these advanced techniques can significantly enhance a trader’s ability to interpret market behavior and execute informed trading decisions.

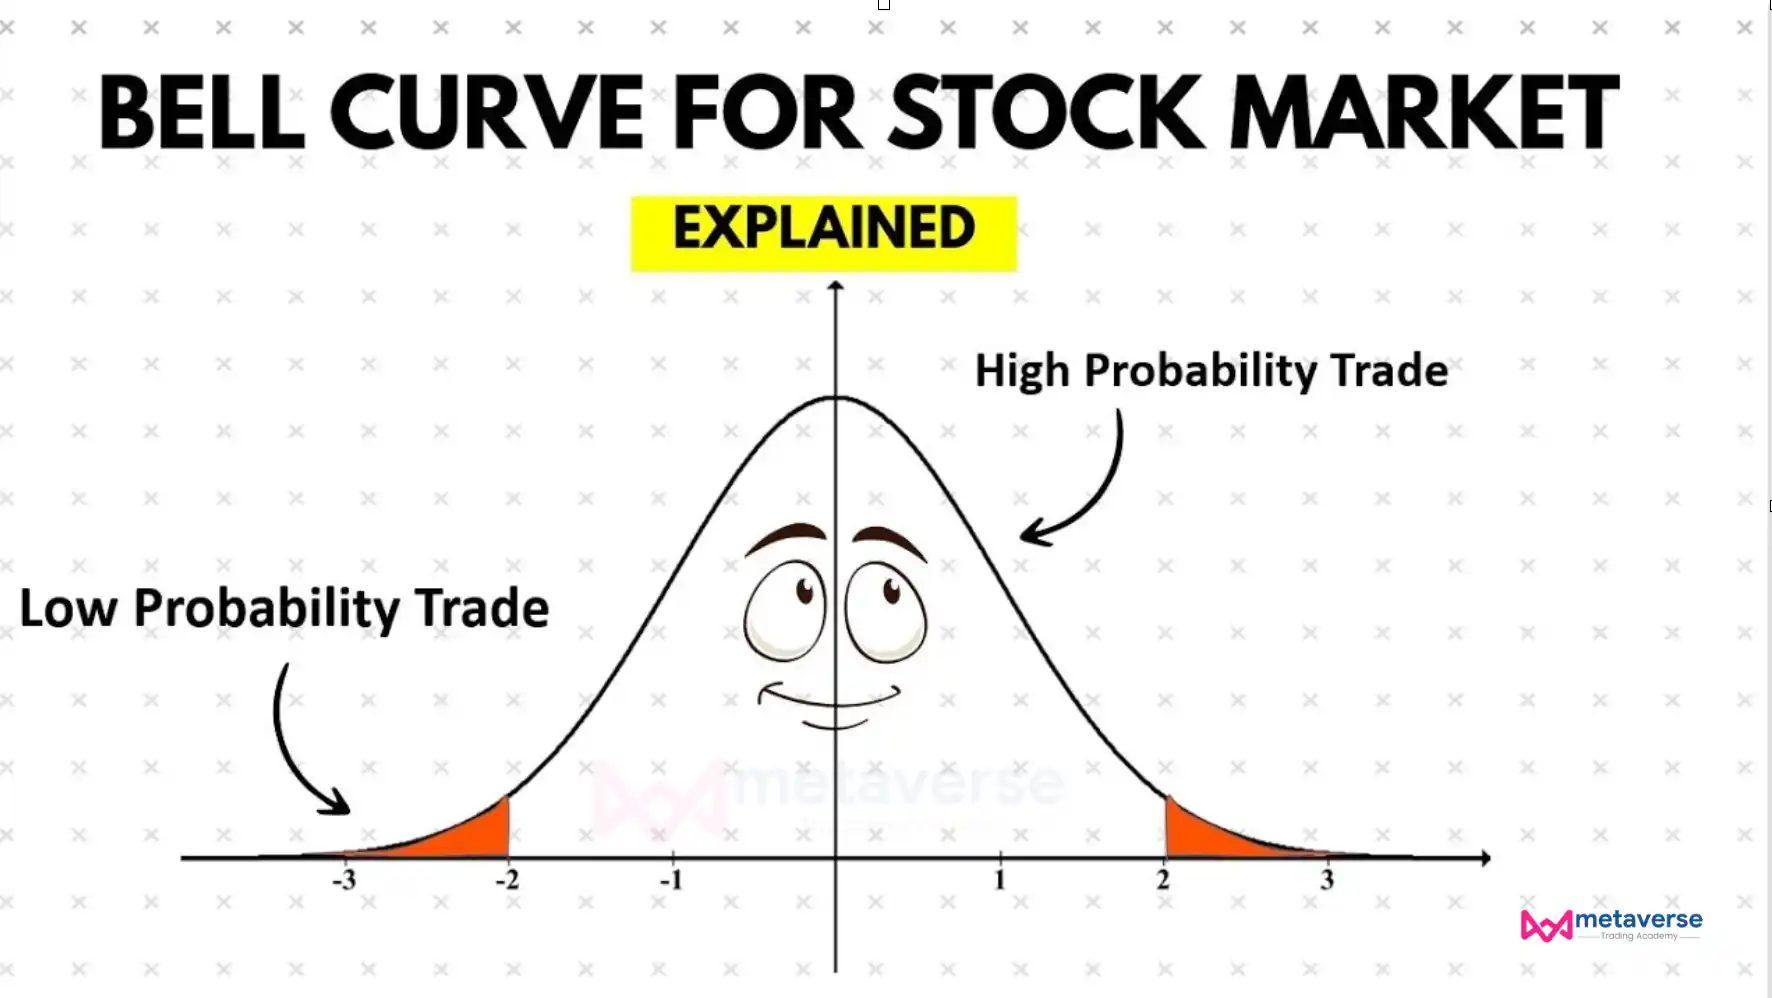
6. What is the Bell Curve?

The Bell Curve is a statistical representation of a normal distribution, also known as a Gaussian distribution. In the context of market profile, it illustrates the distribution of prices for a particular stock, commodity, or financial instrument over a specified period of time. The bell curve market profile highlights the average price for the instrument, with deviations from the average represented by standard deviations, offering a clear visual representation of price distribution.

Market profile, including tools like volume profile, helps traders and investors understand price behavior by identifying market trends, support and resistance levels, and potential trade opportunities. By analyzing the bell curve in market profile, traders can gain insights into price acceptance areas and the market’s overall sentiment.

Order flow trading strategies often utilize the bell curve to pinpoint key areas of market activity and align trading decisions with prevailing trends. Aspiring traders can master these concepts and other advanced techniques by enrolling in the best trading academy in India, where they learn to integrate tools like market profile, order flow analysis, and volume profile into their trading strategies for better decision-making.

The CLBS shift

Same market. A completely different you.

Most traders only ever see price. CLBS trains you to see what moves it, and that changes every decision you make.

Before CLBS

  • Following someone else's calls
  • Entering late, after the move
  • Hoping a losing trade comes back
  • Chasing losses with bigger trades
  • Confused about why price moved

After 45 days

  • Mapping your own levels
  • Entering with a clear plan
  • Knowing where you're wrong
  • Protecting capital with rules
  • Seeing what moves the price
ClarityKnow what the market is doing, and why.
ConfidenceAct on your own read, not someone's tip.
IndependenceA skill you keep for life, in any market.

Why Metaverse Trading Academy?

Metaverse Trading Academy has imparted successful training strategies and real-world applications that have helped earn the Excellence award of being the Best Trading Academy in India.

Trade with Confidence

  • Grasp the markets with best trading academy in India.
  • Real trades, in real-time, not hypothetical or theory.
  • Receive market analysis from well-seasoned market analysts.

Unlock More Opportunities

  • Trade a large range of instruments including FX, CFDs, and commodities.
  • Enjoy seamless trading with the best trading academy in India.
  • Premium client service is available for eligible clients.

Never Stop Learning

  • Reach your trading goals with access to award-winning educational resources.
  • Fine-tune your trading strategies with the latest technical and fundamental analysis.
  • Learn from other traders with automated trading with the best trading academy.
Questions, answered

Getting started.

I don't know the basics. Can I still join?

Yes. We start from the fundamentals and build step by step. You need patience, not experience.

I already trade. Can I go straight to advanced topics?

Yes. After a short readiness check, mentors place you at the right starting point. Learn what you need, skip what you know.

How much time do I need?

Plan for focused daily practice during the 45 days. Evening classes and recordings make it possible alongside a job.

Are sessions recorded?

Yes. All important sessions are recorded, with notes and templates, so you can revise anytime.

Which AI do I need?

Any capable AI that reads PDFs, such as Claude, ChatGPT or Gemini. We set it up with you, so it becomes your personal CLBS co-pilot.

Will I get tips or buy/sell calls?

We give you something better: the skill to read the market yourself, so you never have to depend on anyone's calls again.

Watch us live first. Then decide.

Follow our free daily live market updates. See the CLBS framework read the market in real time, timestamped and reviewed openly, before and after the move.

WhatsApp +91 98984 66966Join free Telegram

Click below to Chat with our Team or Ask any Questions!