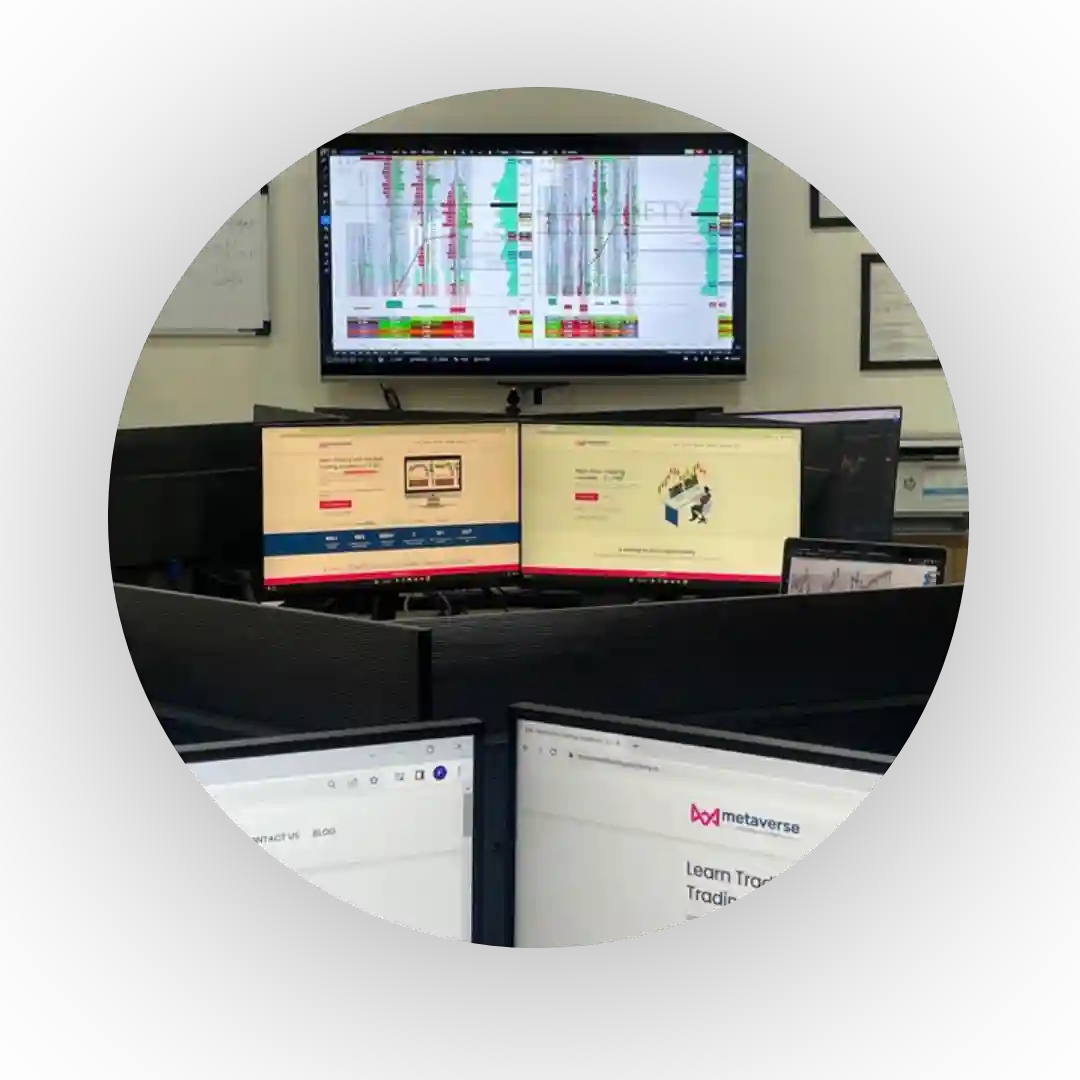
Metaverse Trading Academy is best trading academy in india to learn stock trading using order flow, market profile, volume profile, option chain etc.
Rajkot, Gujarat, India


Liquidity zones are the areas on a price chart where institutional traders accumulate or distribute large positions. Knowing how to identify liquidity zones — and more importantly, how to trade them — is one of the highest-value skills in modern trading. Whether you trade Nifty futures, BankNifty options, Forex, or stocks, liquidity zone analysis helps you stop getting trapped by stop hunts, anticipate reversals before they happen, and align your entries with institutional order flow.
In this complete 2026 guide, you will learn what liquidity zones are, how to mark them on any chart, and a step-by-step liquidity trading strategy with real examples..
Understanding the two sides of liquidity is the foundation of institutional trading analysis.
Buy side liquidity refers to a cluster of buy stop orders sitting above a key high — such as a previous swing high, a equal high, or a round number. Institutions sell into these levels because the buy stops provide the liquidity they need to fill large short positions.
Sell side liquidity refers to a cluster of sell stop orders sitting below a key low — such as a swing low, a previous support level, or a round number. Institutions buy into these sweeps to fill large long positions. This is why price so often spikes above a high or below a low briefly before reversing sharply. That spike is not random — it is a deliberate liquidity grab designed to trigger retail stop losses and provide the other side of the institutional trade.
Draw on liquidity is the concept that price is always moving toward the nearest liquidity pool. On any higher timeframe, you can identify where the next pool of resting orders sits and anticipate the next major price move in that direction before it begins.

Best Indicators and Tools to Identify Liquidity Zones While experienced traders identify liquidity zones purely through price action, using the right tools can significantly speed up the process — especially for beginners.
For Indian traders (Nifty and BankNifty):
TradingView (free) — Use the “Liquidity Zones” or “Liquidity Pools” indicator from the community scripts section. It automatically marks equal highs/lows and stop clusters.
ATAS — Shows real-time order flow and delta alongside your chart, making it easy to confirm when a liquidity grab has occurred.
Zerodha Kite + Pi — No built-in liquidity zone tool, but you can manually mark zones using horizontal lines on key swing points.
Sensibull — Useful for options traders to check where max pain and PCR levels sit, which often align with institutional liquidity areas.
For Forex and global markets:
Bookmap — Best for visualizing real-time liquidity on the DOM (Depth of Market). —
Sierra Chart — Professional-grade order flow with liquidity heatmaps. Key principle: No indicator replaces chart reading. Use these tools to support your analysis, not replace it. The best liquidity zones are identified by studying price behavior at key structural levels over time.
Identifying liquidity zones involves looking for areas where price is likely to return in order to grab resting orders. These zones are often created by human behavior and manipulated by institutions.

One of the most profitable insights in trading liquidity concepts is recognizing when the market is hunting stops.

Here is a real-world example of how a liquidity zone trade looks on Nifty50 futures using the strategy above.
Step 1 — Mark the previous day’s high and low On the 15-minute chart of Nifty, mark the prior day’s high. This level holds a cluster of buy stop orders from traders who were short and placed their stops just above the high. This is a buy side liquidity zone.
Step 2 — Wait for the price sweep At 9:45 AM the next morning, Nifty spikes 40 points above the previous day’s high. This is the liquidity grab — institutions are triggering those buy stops to fill their short positions.
Step 3 — Confirm the reversal After the spike, a bearish engulfing candle forms on the 5-minute chart. On ATAS, delta turns sharply negative — confirming that sellers are absorbing all the buying aggression from the stop triggers.
Step 4 — Enter the trade Short entry: on the close of the bearish confirmation candle, just after the sweep. Stop loss: 15 points above the wick high (above the liquidity sweep itself). Target: previous day’s low — the opposite sell side liquidity zone, approximately 120 points below entry.
Step 5 — Result Price moves cleanly toward the target without pulling back. Risk-reward on this setup: 1:8 (15 points risk, 120 points reward).

Liquidity Zones in Nifty and BankNifty — What Indian Traders Need to Know Liquidity zone behavior in Indian markets has some specific characteristics that international guides do not cover.
Expiry day liquidity grabs — On Thursday expiry days (weekly Nifty and BankNifty options), institutional players frequently run liquidity sweeps in the first 30–60 minutes. They push price above obvious call resistance or below obvious put support to trigger retail stop losses, then reverse sharply. This is one of the most reliable liquidity trading setups in Indian markets.
9:15 AM to 9:30 AM gap liquidity — The NSE opening often creates a gap above or below the previous day’s close. This gap frequently sweeps a liquidity level before true price discovery begins. Avoid entering the first 15 minutes instead, watch which side gets swept and trade the reversal.
Key liquidity levels to mark on Nifty every week — Previous week high and low Previous month high and low Round number levels (e.g., 22000, 22500, 23000) ATM strike price on options expiry day Max pain level (available on NSE website and Sensibull)
FII vs DII flow and liquidity — When FII data shows heavy net selling, they are often building short positions by triggering buy side liquidity zones. Tracking FII/DII flow alongside your liquidity zone analysis gives you confirmation of which direction institutions are positioned.
Volume Profile – Volume Profile is a powerful trading tool that shows the distribution of traded volume over different price levels rather than time. Unlike traditional volume indicators that display total volume per candle, Volume Profile reveals where most buying and selling occurred across a price range, helping traders identify high-interest levels such as Point of Control (POC), value areas, and support/resistance zones.
By analyzing volume concentration, traders can detect areas of accumulation or distribution and predict potential price reactions. It’s commonly used in conjunction with price action to gauge market sentiment and make informed entries or exits. This tool is especially effective in spotting balance (consolidation) and imbalance (breakout) zones, providing a visual map of supply and demand.
Market Structure Indicators – Market structure indicators help traders identify the underlying framework of price action—higher highs, lower lows, trends, and consolidation zones. These indicators assist in pinpointing key elements such as support/resistance, swing highs/lows, and trend reversals. Tools like the ZigZag indicator, structure swing indicators, or even manually drawn lines can reflect the market’s behavior in a structured format.
Recognizing market structure is essential for technical analysis, as it forms the basis of many strategies such as breakouts, pullbacks, and trend continuation. By understanding where price is in relation to its structure, traders can align their decisions with prevailing market dynamics.
Order Flow Platform – An order flow platform is specialized software that allows traders to view and analyze the actual flow of buy and sell orders in real time. It typically includes tools like footprint charts, depth of market (DOM), and volume delta analysis. Unlike standard charting platforms, order flow tools focus on microstructure—who is buying, who is selling, and at what prices.
This level of detail helps short-term and professional traders assess momentum, spot hidden support/resistance, and make precise entries. Popular platforms include Sierra Chart, Bookmap, and ATAS. By visualizing real-time liquidity and aggression, traders can gain a deeper edge in fast-moving markets.

Avoid these pitfalls to improve your win rate:

A liquidity zone is a price area where a large number of buy or sell orders are clustered. These are typically formed around swing highs, swing lows, equal highs or lows, and round numbers. Institutions target these zones to fill large positions by triggering the stop orders of retail traders.
Mark previous swing highs and lows, equal highs or lows, and psychological round numbers. Any level where price has reversed multiple times, or where obvious stop losses would be placed, is a liquidity zone. Use horizontal lines to mark these levels on a higher timeframe (H1, H4, or Daily) for the most reliable zones.
Liquidity is more than just a buzzword—it’s the invisible force that shapes every market move. By learning to identify liquidity zones and trading with institutional flow rather than against it, you gain a powerful edge in any financial market.
From recognizing stop hunts and understanding order blocks to executing smart entries after liquidity grabs, the concepts shared in this guide give you a roadmap for smarter, more strategic trades. Instead of being reactive, you become predictive—trading where the big players trade, and avoiding the traps that catch most retail traders off guard.
Mastering liquidity allows you to time entries with greater precision, manage risk more effectively, and capitalize on high-probability setups. Whether you’re new to trading or refining an advanced system, incorporating liquidity concepts can significantly boost your success rate.
Start applying liquidity analysis to your charts today. Go back through recent trades and identify where liquidity played a role. The more you practice, the more intuitive it becomes.
Ready to take your trading to the next level? Follow us for more in-depth strategies and tutorials on liquidity and market structure. Stay ahead of the crowd—and trade like the pros.


Disclaimer: Investing/Trading in the stock market is subject to market risks, and there is no assurance or guarantee of returns—neither the principal nor the appreciation of the investments. The content/education/training provided by Metaverse Trading Academy, its institute, mentors, trainers, representatives, or their assigns is solely for general interest, educational purposes, and the reader’s information. All participants are requested to seek independent expert opinions before acting on anything mentioned in this course/program. We are not liable or responsible for any decisions made by the participant solely based on the information provided here. All information/views/opinions shared in the course/program are our interpretation for educational understanding only, and we cannot be held responsible for any miscommunication, misinformation, misunderstanding, or any actions taken by an individual or group based on the course/program. By enrolling in and accessing the program/course, you accept this “Disclaimer,” without limitation or qualification. Upon viewing this disclaimer, you understand and acknowledge that there is a very high degree of risk involved if any information is misinterpreted, misused, or applied without proper risk management and independent judgment. As stipulated by law, Metaverse Trading Academy cannot and does not make any guarantees about your ability to get results or earn money with any ideas, information, tools, indicators, systems, or strategies from the course/program. The participant should understand that all ideas, information, tools, strategies, examples, and market discussions shared during the course/program are for educational and informational purposes only. Metaverse Trading Academy, its founders, mentors, trainers, management, and team members are neither responsible nor liable for any losses, damages, or consequences resulting from investments or trading activities. You alone are fully responsible and accountable for your decisions, actions, trades, investments, and results in life. By registering here, enrolling in any program, or accessing any material, you agree not to attempt to hold Metaverse Trading Academy, its founders, mentors, trainers, management, or team liable for your decisions, actions, or results, at any time, under any circumstance.