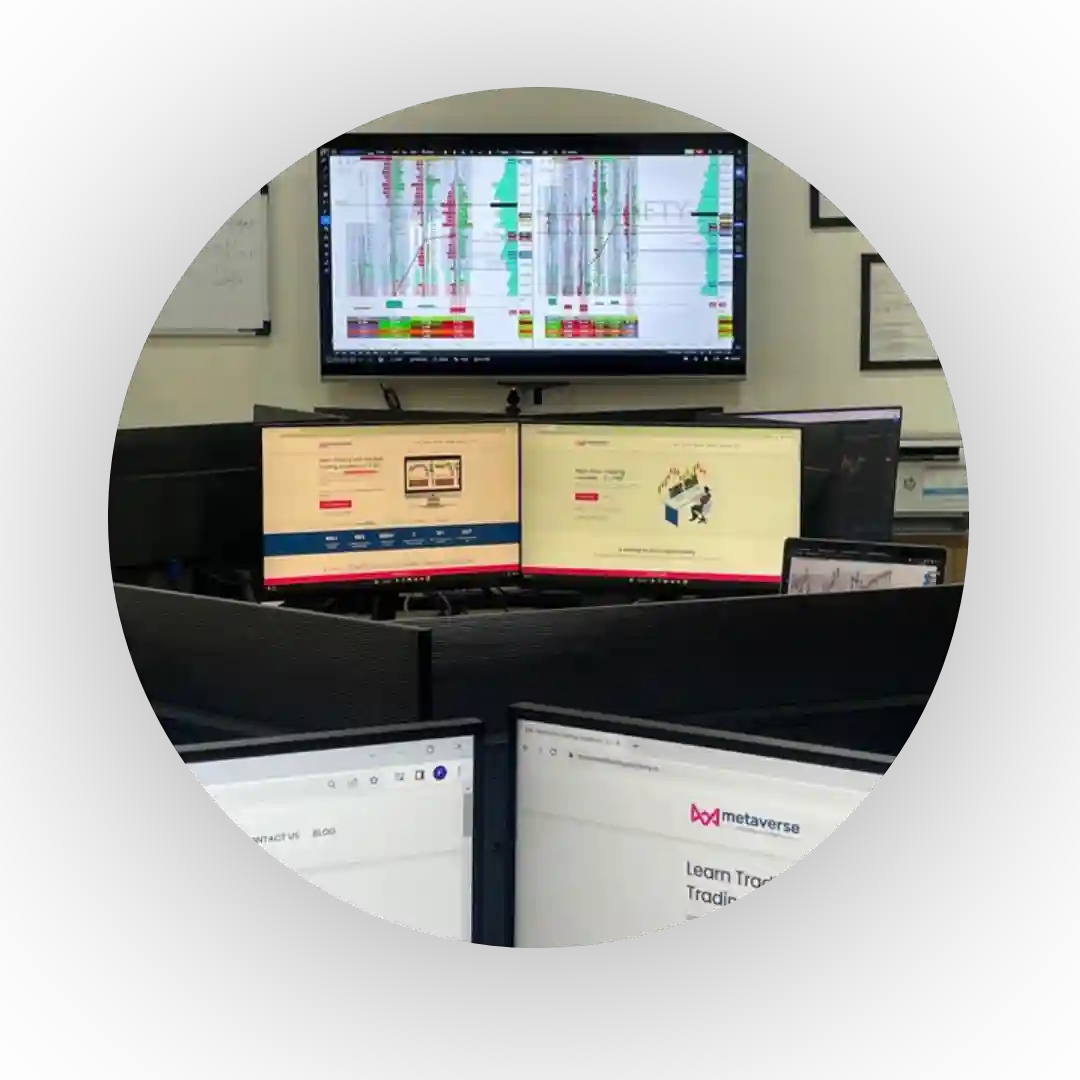
Metaverse Trading Academy is best trading academy in india to learn stock trading using order flow, market profile, volume profile, option chain etc.
Rajkot, Gujarat, India


In fast-moving markets, knowing how to capture big reversals can lead to major profits. Traditional indicators often lag, but Order Flow Trading gives you a real-time view of market pressure by showing actual buy and sell transactions. This helps traders spot who controls the market — buyers or sellers — and anticipate reversals before they appear on the charts.
Big reversals are usually driven by institutions, not retail traders. They leave behind clues like volume spikes and hidden order activity. By using Order Flow Trading, you can detect these signs early and avoid false breakouts. No matter the asset — forex, stocks, futures, or crypto — learning how to capture big reversals with order flow techniques gives you a smarter, more confident edge in trading.
Before diving into techniques, it’s essential to understand the core of Order flow Trading.
In simple terms, while a candlestick tells you what happened after trades were executed, Order flow tells you as it’s happening.
Order flow Trading requires specific tools and platforms designed to capture real-time market data.
Footprint charts display the volume traded at each price level within a single candle or bar, offering a detailed view of market activity. They show how many contracts were bought at the ask and sold at the bid, helping traders identify buying and selling imbalances. Unlike traditional candlesticks, footprint charts reveal who’s in control — buyers or sellers — and highlight areas of aggression or absorption. These charts are essential for Orderflow Trading, as they allow traders to spot key turning points, exhaustion, and hidden support or resistance levels that are invisible on standard charts.
Delta indicators measure the difference between aggressive buyers and sellers in the market. Specifically, they subtract the number of contracts sold at the bid price from those bought at the ask price during a specific period. A positive delta indicates more aggressive buying, while a negative delta suggests dominant selling. Traders use delta to confirm trends, detect potential reversals, or spot divergence between price and volume pressure. In Orderflow Trading, delta provides insights into the strength behind a move, allowing traders to gauge if price action is supported by real momentum or likely to reverse.
Cumulative Delta is the running total of delta values over time, providing a broader view of buyer-versus-seller pressure. Instead of analyzing delta for just one bar, cumulative delta tracks whether buyers or sellers are consistently in control. Traders use it to confirm breakouts, spot trend exhaustion, and detect hidden divergence — for example, when price rises but cumulative delta falls, signaling weakening buying strength. In Orderflow Trading, this tool is critical for aligning short-term price moves with underlying market intent, helping traders avoid false signals and better time entries and exits based on sustained order flow.
Volume Profile is a charting tool that plots the total traded volume at each price level over a specific time period. It highlights where the most buying and selling occurred, showing high-volume nodes (support/resistance zones) and low-volume areas (potential breakout zones). Traders use Volume Profile to understand where the market finds value and where it rejects price. In Orderflow Trading, this helps identify balance areas, liquidity zones, and price levels where reversals or continuations are likely. It gives a structural view of the market, revealing key zones for smart money activity, not visible with standard indicators.
Order Book Depth, also called Level 2 data, shows the number of buy and sell limit orders waiting at different price levels. It provides insight into market liquidity and the potential strength of support or resistance. The “depth” refers to how many layers of orders are visible above and below the current price. In Orderflow Trading, analyzing order book depth helps traders anticipate potential reversals, identify spoofing (fake orders), and understand where large players are likely to engage. It’s a real-time view of market intent, allowing for more informed decision-making in fast-moving conditions.
Each tool provides a layer of insight, helping you predict when a market reversal is likely brewing.
Capturing major reversals is about recognizing exhaustion and aggression at key levels.
Combine at least two or more signals for a higher probability setup rather than relying on a single indicator.
Here’s a structured approach to trading reversals using Order flow Trading:

Avoid these pitfalls to increase your success rate:
Capturing big reversals isn’t about guessing tops and bottoms. It’s about reading the real forces at play in the market — the buyers and sellers — and acting based on facts, not feelings. Order flow Trading gives you the tools to see behind the curtain, revealing when momentum is about to shift dramatically.
By understanding exhaustion, absorption, delta divergence, and volume climaxes, you can anticipate reversals with greater accuracy and confidence. Using the actionable steps shared in this guide, you’ll avoid the traps that catch most retail traders and instead align yourself with the smart money moves.
Remember, successful Order flow Trading requires discipline, patience, and consistent practice. As you refine your skills, you’ll be able to spot powerful reversals before they explode — giving you a decisive edge in any market.
Ready to take control of your trading? Dive deeper into Order flow Trading, practice these techniques, and watch your ability to capture big reversals skyrocket. Follow us for more in-depth guides, trade examples, and real-time Order flow insights!


Disclaimer: Investing/Trading in the stock market is subject to market risks, and there is no assurance or guarantee of returns—neither the principal nor the appreciation of the investments. The content/education/training provided by Metaverse Trading Academy, its institute, mentors, trainers, representatives, or their assigns is solely for general interest, educational purposes, and the reader’s information. All participants are requested to seek independent expert opinions before acting on anything mentioned in this course/program. We are not liable or responsible for any decisions made by the participant solely based on the information provided here. All information/views/opinions shared in the course/program are our interpretation for educational understanding only, and we cannot be held responsible for any miscommunication, misinformation, misunderstanding, or any actions taken by an individual or group based on the course/program. By enrolling in and accessing the program/course, you accept this “Disclaimer,” without limitation or qualification. Upon viewing this disclaimer, you understand and acknowledge that there is a very high degree of risk involved if any information is misinterpreted, misused, or applied without proper risk management and independent judgment. As stipulated by law, Metaverse Trading Academy cannot and does not make any guarantees about your ability to get results or earn money with any ideas, information, tools, indicators, systems, or strategies from the course/program. The participant should understand that all ideas, information, tools, strategies, examples, and market discussions shared during the course/program are for educational and informational purposes only. Metaverse Trading Academy, its founders, mentors, trainers, management, and team members are neither responsible nor liable for any losses, damages, or consequences resulting from investments or trading activities. You alone are fully responsible and accountable for your decisions, actions, trades, investments, and results in life. By registering here, enrolling in any program, or accessing any material, you agree not to attempt to hold Metaverse Trading Academy, its founders, mentors, trainers, management, or team liable for your decisions, actions, or results, at any time, under any circumstance.