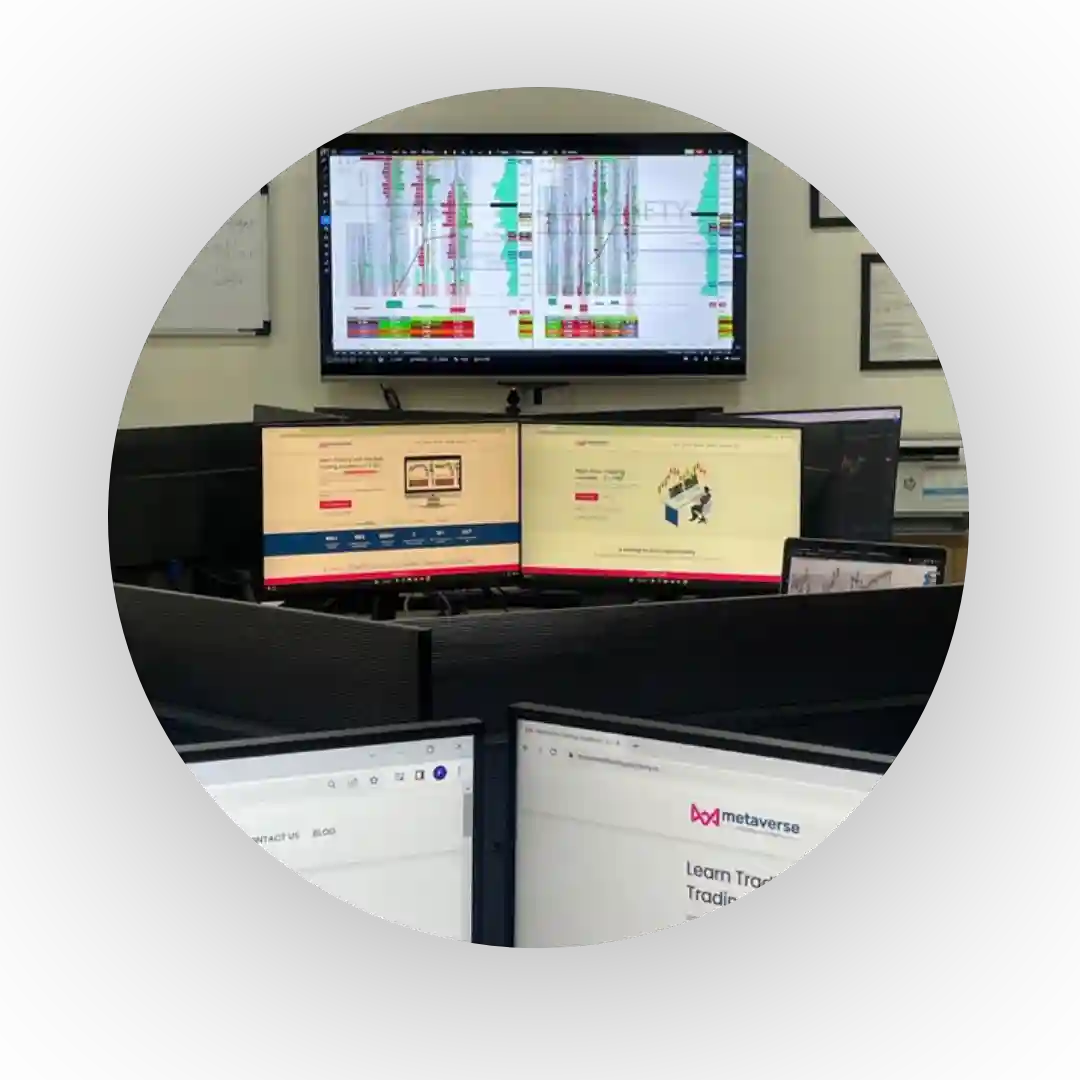
Practical guides from Vikas Gahlot and the Metaverse mentor team. Learn how institutions read the market, one concept at a time.

Learn the opening range breakout (ORB) strategy for Nifty and Bank Nifty: how to mark the range, entry rules, stop loss, targets and filters…
Read the guide →
Learn option Greeks in simple words: delta, gamma, theta, vega and rho, plus hidden Greeks charm and vanna, with Nifty examples for buyers and…
Read more →
Learn implied volatility in options: how IV is calculated, how to turn it into an expected move, IV rank vs IV percentile, vega, IV…
Read more →
Learn gamma exposure (GEX) in simple words: positive vs negative gamma, the gamma flip, call and put walls, and how to read a gamma…
Read more →
Learn Initial Balance in Market Profile, including IB ranges, breakout strategies, day types, VWAP, volume profile, and Nifty trading setups.
Read more →
Learn what a Footprint Chart is and how institutions hide large orders. Read bid ask volume, delta and imbalances clearly.
Read more →
Learn how to identify order flow absorption using footprint charts, delta, volume, and DOM to spot potential reversals.
Read more →
Learn how to identify iceberg orders with footprint charts, DOM, delta, and volume profile to detect hidden liquidity.
Read more →
Learn how Anchored VWAP works, how to choose anchor points, and how traders use it for support, resistance, and trend confirmation.
Read more →
Understand Cumulative Volume Delta, how it's calculated, and how traders use CVD divergence to confirm trends and spot reversals.
Read more →Get the free CLBS V18 brochure: the five-step framework, the 45-day path and how our live trading room works.
Download CLBS V18 Brochure WhatsApp usGet the free CLBS V18 brochure, or talk to our mentor team on WhatsApp.

Institutional market reading, taught live. Learn Order Flow, Market Profile, Volume Profile, Option Chain and VWAP with Vikas Gahlot and the mentor team.