In today’s fast-paced trading environment, having a robust and effective strategy is crucial to maximize profits. For options traders, one of the most powerful yet underutilized tools is Open Interest (OI). Understanding how to interpret and apply open interest data can give you an edge over others in the market, helping you identify potential price trends, evaluate market sentiment, and optimize your trades.
This is where GoCharting’s Option Chain comes into play. It offers an advanced, user-friendly interface to analyze open interest like never before. With a foolproof Open Interest Strategy, you can harness the full potential of this tool to make informed, profitable decisions.
Before jumping into actionable strategies, it’s important to grasp what open interest is and why it matters:
What is Open Interest? Open interest refers to the total number of outstanding contracts (calls or puts) in the market. It shows how much money is flowing into or out of a specific strike price or expiration date.
Why is Open Interest Important? High open interest often signals strong market activity and liquidity, making it easier to enter and exit positions. It also helps traders gauge market sentiment and potential price movements.
With this foundation, let’s move to the core strategies.
Actionable Steps to Build a Foolproof Open Interest Strategy on GoCharting
1: Setting Up GoCharting for Open Interest Analysis
Create an Account on GoCharting
Sign up on GoCharting’s platform if you haven’t already.
Navigate to the Option Chain Tool
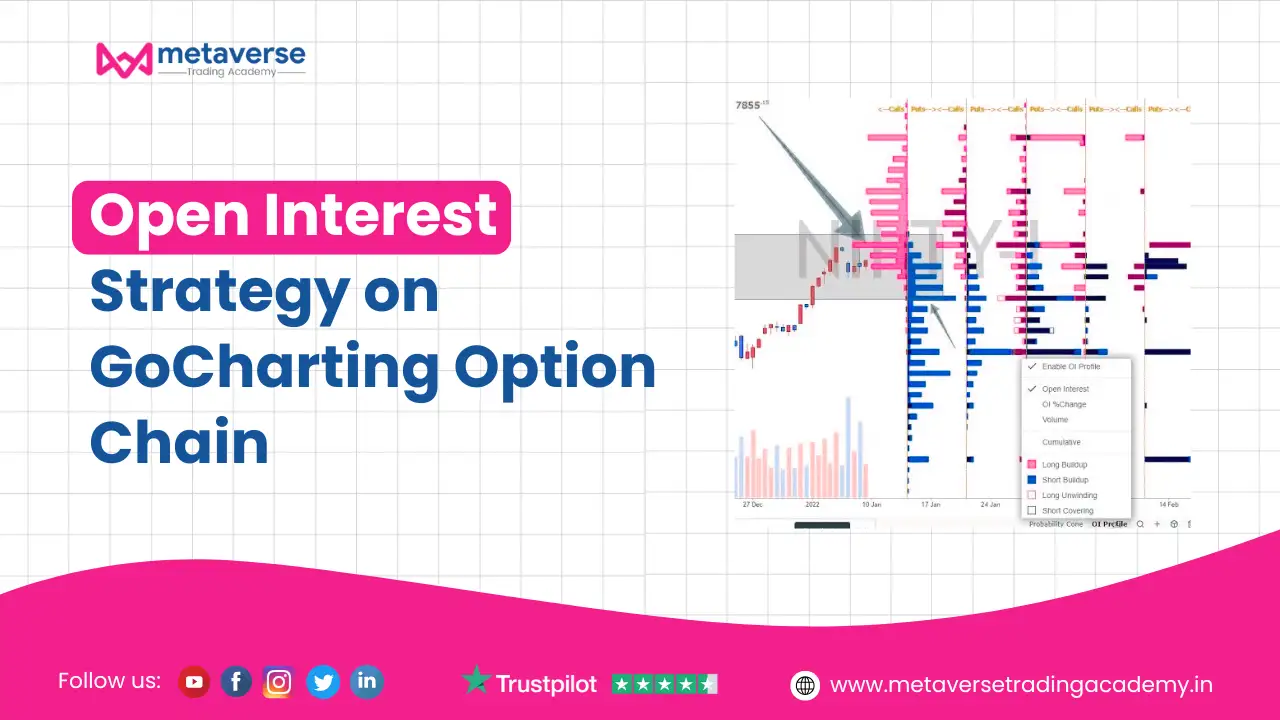
Access the Option Chain feature, which displays real-time OI data alongside strike prices, premiums, and implied volatility.
Customize Your View
Apply filters for strikes, expiries, or specific stocks to narrow down your analysis.
Pro Tip: Use the heatmap feature on GoCharting to identify high OI levels at a glance.
2: Identifying Key Levels Using Open Interest
Spotting Support and Resistance Levels
High open interest at specific strike prices often acts as psychological support or resistance zones.
Example: If the OI for a 18,000 strike price call option is significantly high, it could signal a strong resistance level.
Monitor Changes in Open Interest
An increase in OI with rising prices signals bullish sentiment.
An increase in Open Interest (OI) accompanied by rising prices is a strong indicator of bullish market sentiment. Here’s why:
What it means: Open Interest represents the number of active contracts in the market. When OI increases, it signals that new positions are being created, showing heightened market participation.
Why rising prices matter: If prices are climbing while OI is increasing, it typically means buyers are actively opening new long positions. This reflects strong confidence in further price appreciation.
Confirmation of trend: This combination confirms that the upward movement isn’t just a temporary spike but is backed by robust market activity.
Key takeaway: An increase in OI with rising prices suggests sustained buying pressure and higher demand, signaling a bullish outlook. Traders can use this signal to identify entry points for long positions or hold onto existing bullish trades confidently.
A decrease in OI with falling prices often indicates bearish sentiment.
A decrease in Open Interest (OI) alongside falling prices often signals bearish sentiment in the market.
What it indicates: Open Interest represents the total number of active contracts. When OI declines, it suggests traders are closing their positions, reducing overall market participation.
Why falling prices matter: If prices are dropping while OI decreases, it typically means long positions are being unwound, or buyers are exiting the market. This lack of interest or confidence in maintaining positions contributes to continued price declines.
Confirmation of bearish sentiment: This pattern reinforces that the downward price trend is driven by reduced market activity, with traders exiting instead of initiating new positions.
Key takeaway: A decrease in OI with falling prices reflects weak demand and diminishing market confidence, signaling bearish momentum. Traders can use this insight to exit long positions or consider shorting opportunities.
3: Combining Open Interest with Volume Data
Interpreting the Volume-to-OI Ratio
A high volume-to-OI ratio often suggests new positions are being added, while a low ratio may indicate position closures.
The volume-to-open interest (OI) ratio is a critical metric for understanding market activity and trader sentiment. A high volume-to-OI ratio often indicates that new positions are being created. This suggests a surge in market participation, as a large number of trades are being executed relative to existing contracts. When paired with rising prices, it reflects bullish sentiment, signaling that buyers are entering the market aggressively.
On the other hand, a low volume-to-OI ratio typically means fewer new positions are being added, with most trades being the closing of existing contracts. This may signify that market participants are losing interest or taking profits, especially during a price decline, reinforcing bearish sentiment.
Key takeaway: Traders can use the volume-to-OI ratio to determine if the market is seeing fresh interest or position closures, helping them confirm trends and plan their entry or exit strategies effectively.
4: Using Open Interest to Predict Market Trends
Bullish Signals
Rising OI along with increasing premiums for call options.
Falling OI for puts at lower strike prices.
Bearish Signals
Increasing OI with rising premiums for put options.
High open interest (OI) levels often mark critical support or resistance zones, making them valuable for identifying potential entry points. When price approaches a strike price with significant OI, it can signal an area where traders are heavily positioned.
Breakouts: If price breaks through a high OI level with strong momentum, it indicates a potential trend continuation.
Reversals: If price fails to breach a high OI level, it often leads to a reversal as market participants adjust positions.
Traders can use these levels strategically to time their entries for higher probability trades.
Avoid Traps
Be cautious of extremely high OI, which can sometimes signal overcrowded trades.
Extremely high open interest (OI) can sometimes indicate overcrowded trades, where too many participants have taken similar positions. This often leads to increased risk of sudden reversals or sharp price movements. When OI becomes excessively concentrated at specific strike prices, it may signal that the market is heavily one-sided, reducing the likelihood of sustained trends.
Key takeaway: Traders should be cautious of overly high OI levels and look for additional confirmation, such as volume trends or price action, before entering trades. Diversifying analysis beyond OI can help avoid the pitfalls of crowded positions and unexpected market shifts.
GoCharting provides live updates on OI, giving you an edge in fast-moving markets.
Focus on Liquid Options
Prioritize options with high OI and volume for better execution.
Backtest Your Strategy
Use historical data on GoCharting to validate your assumptions before trading live.
Common Pitfalls to Avoid
Over-relying on OI without considering market news or macro factors.
Ignoring changes in implied volatility (IV), which can skew premiums.
Misinterpreting OI data without context—always analyze in conjunction with price movement.
Watch and Learn: Video Tutorials
Explore our video tutorials to deepen your understanding of the Open Interest Strategy on GoCharting. Learn how to analyze OI data, identify key support and resistance levels, and combine OI with volume and price action to maximize your trading profits.
Conclusion: Unlock the Power of Open Interest Strategy
Mastering the Open Interest Strategy with tools like GoCharting’s Option Chain can transform your trading approach. By understanding the nuances of open interest and integrating it with volume, support and resistance levels, and other indicators, you can make more informed and profitable decisions.
Remember, consistency and continuous learning are key to success in trading. Start by exploring GoCharting today, apply the strategies outlined in this guide, and watch your trading performance soar.
If you want to take your learning further, join Metaverse Trading Academy, where more than 50,000 students have already learned advanced strategies like Order Flow and Market Profile trading. Start your journey today at metaversetradingacademy.in.
NISM-certified trader, technical analyst, and founder of Metaverse Trading Academy. With more than 10 years of experience in stock market trading and technical analysis, I have trained over 10,000 students across India through online and offline trading programs focused on intraday trading, swing trading, futures & options, and risk management.
Leave A Comment
Click below to Chat with our Team or Ask any Questions!