Metaverse Trading Academy is best trading academy in india to learn stock trading using order flow, market profile, volume profile, option chain etc.
Rajkot, Gujarat, India

In the world of trading, there are a multitude of strategies and theories that traders can utilize to improve their decision-making and ultimately, their profitability. The Volume Weighted Average Price (VWAP) theory has emerged as one of the most popular trading strategies in recent years. However, VWAP is just one of the many trading concepts that traders can use to analyze and understand the market.
In this trading guide, we will delve deeper into the world of trading and explore some lesser-known yet highly effective concepts such as Delta Divergence, Option Chain, and Bell Curve. These concepts can help traders make more informed trading decisions and navigate the often unpredictable waters of the stock market. By the end of this guide, traders will better understand these concepts and apply them in real-world trading scenarios to improve success.

Traders use the Volume-Weighted Average Price (VWAP) theory to assess the average price of a security over a specific period. They calculate VWAP by dividing the total traded value (price × volume) by the total traded volume over the selected timeframe. Traders and investors often use this metric as a benchmark to evaluate trade performance.
According to VWAP theory, a price above VWAP signals a premium, while a price below VWAP indicates a discount. Traders and investors use this theory to identify overbought or oversold conditions and spot potential trading opportunities. Additionally, traders use VWAP to manage large trades, assess fair price, and determine the best execution timing.
This in order flow strategy refers to the difference between the delta of an option and the underlying security’s price change. Delta measures the rate of change in an option’s price with respect to the change in the price of the underlying security. Delta Divergence occurs when the delta of an option changes in a direction opposite to the direction of the underlying security’s price movement.
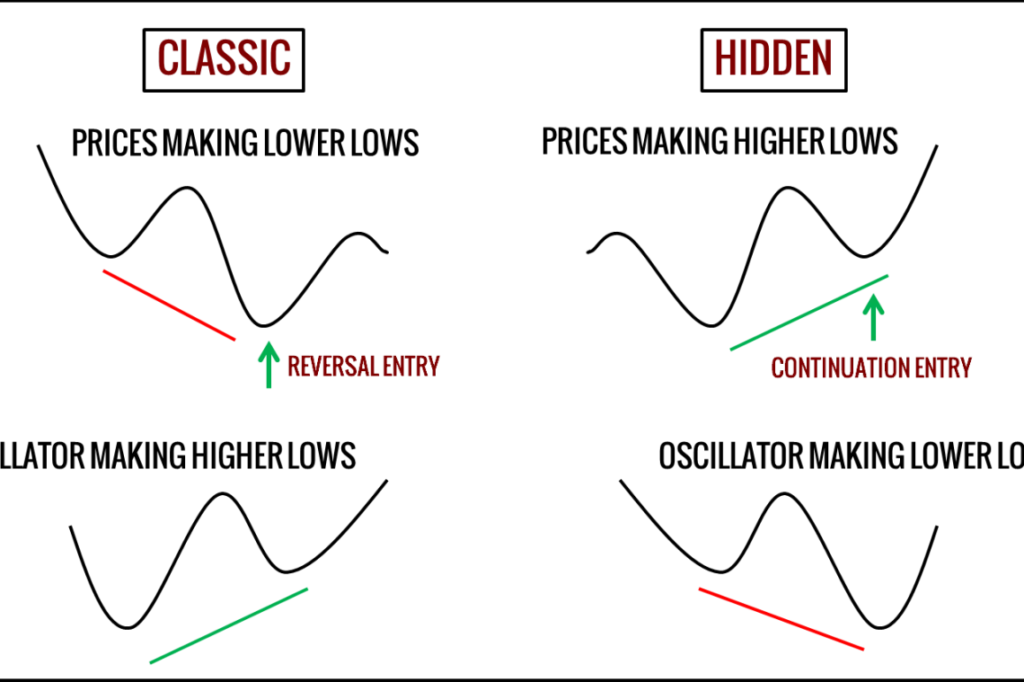
In order flow analysis, delta divergence can be an important signal for traders because it can indicate changes in market sentiment and potential shifts in buying or selling pressure. For example, if the delta of a call option increases while the underlying stock price decreases, this could indicate that traders are becoming more bullish and that buying pressure is increasing. On the other hand, if the delta of a call option decreases while the underlying stock price increases, this could indicate that traders are becoming more bearish and that selling pressure is increasing.
Traders can combine Delta Divergence analysis with order flow indicators like volume profile to make more informed decisions. However, traders should treat delta divergence as one factor among many and avoid using it as the sole basis for decisions.

Option chains are important in trading because they provide information about the various options contracts available for a particular underlying asset. An option chain is a list of all available options contracts for a specific stock, index, commodity, or other underlying assets. It includes information about the strike price, expiration date, and the bid and asks price of each option.
This information can be useful for traders because it allows them to assess the current state of the market and make informed decisions about buying and selling options. For example, traders can use option chains to identify potential trades based on the current market sentiment, implied volatility, and other factors.
Traders also use option chains to implement strategies such as covered calls, protective puts, and bullish or bearish spreads. By considering the information provided in the option chain, traders can determine the potential risk and reward of each strategy, and make informed decisions about which options contracts to buy or sell.
Overall, the option chain is an important tool because it gives traders valuable market insights and helps them make informed trading decisions.

The economic view is important in trading because it helps traders and investors to understand the underlying forces that drive market movements and to anticipate future price trends. Economic indicators such as gross domestic product (GDP), inflation, interest rates, employment data, and others provide insight into the overall health of an economy and can have a significant impact on financial markets.
For example, changes in interest rates set by central banks can affect the borrowing costs for businesses and consumers, and can thus influence the performance of stocks, bonds, and other financial instruments. Similarly, changes in employment data and GDP can indicate the strength of consumer spending, which is a key driver of economic growth and can impact the stock market and other financial markets.
By incorporating an economic view into their analysis, traders and investors can make more informed decisions, reduce the risk of unexpected market movements, and potentially increase their profits. Additionally, a deep understanding of the economic environment can also provide valuable context to the current market conditions and help to identify potential market trends.
The Bell Curve is a statistical representation of a normal distribution, also known as a Gaussian distribution. In the context of market profile, it refers to the distribution of prices for a particular stock, commodity, or financial instrument over a specified period of time.
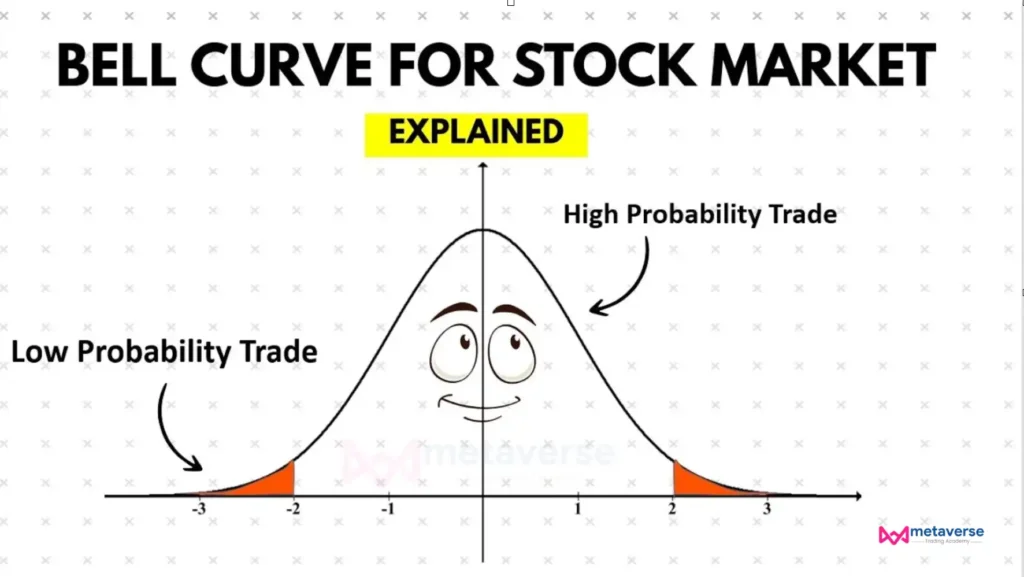
The bell curve market profile represents the average price for the instrument, with deviations from the average represented by standard deviations, creating a visual representation of price distribution. The market profile can help traders and investors identify market trends, support and resistance levels, and potential trade opportunities.
Trading is not just about following one strategy—it’s about combining multiple concepts to strengthen decision-making and adapt to different market conditions. From VWAP to Delta Divergence, each theory offers unique insights that help traders read price action more effectively.
By understanding tools like the Option Chain and analyzing the broader economic view, traders can gain a holistic perspective of the market. Adding statistical frameworks like the Bell Curve further sharpens the ability to identify patterns, support levels, and opportunities hidden within market movements.
In the end, success comes from learning, experimenting, and applying these concepts in real-world scenarios with discipline and proper risk management. The more strategies you master, the more confident and prepared you become to navigate the ever-changing world of trading.


Disclaimer: Investing/Trading in the stock market is subject to market risks, and there is no assurance or guarantee of returns—neither the principal nor the appreciation of the investments. The content/education/training provided by Metaverse Trading Academy, its institute, mentors, trainers, representatives, or their assigns is solely for general interest, educational purposes, and the reader’s information. All participants are requested to seek independent expert opinions before acting on anything mentioned in this course/program. We are not liable or responsible for any decisions made by the participant solely based on the information provided here. All information/views/opinions shared in the course/program are our interpretation for educational understanding only, and we cannot be held responsible for any miscommunication, misinformation, misunderstanding, or any actions taken by an individual or group based on the course/program. By enrolling in and accessing the program/course, you accept this “Disclaimer,” without limitation or qualification. Upon viewing this disclaimer, you understand and acknowledge that there is a very high degree of risk involved if any information is misinterpreted, misused, or applied without proper risk management and independent judgment. As stipulated by law, Metaverse Trading Academy cannot and does not make any guarantees about your ability to get results or earn money with any ideas, information, tools, indicators, systems, or strategies from the course/program. The participant should understand that all ideas, information, tools, strategies, examples, and market discussions shared during the course/program are for educational and informational purposes only. Metaverse Trading Academy, its founders, mentors, trainers, management, and team members are neither responsible nor liable for any losses, damages, or consequences resulting from investments or trading activities. You alone are fully responsible and accountable for your decisions, actions, trades, investments, and results in life. By registering here, enrolling in any program, or accessing any material, you agree not to attempt to hold Metaverse Trading Academy, its founders, mentors, trainers, management, or team liable for your decisions, actions, or results, at any time, under any circumstance.