Why does the same Nifty option cost ₹180 one week and ₹250 the next, even when the index has barely moved?
The answer is implied volatility. Implied volatility, or IV, is the amount of future movement the market is pricing into an option. When traders expect big moves, IV rises and options become expensive. When they expect calm, IV falls and options become cheap. Price is only half the story. IV is the other half.
This guide explains implied volatility in options from the ground up. You will learn what IV is, how it is calculated, how to turn it into an expected move, how to judge if IV is high or low, and how professionals use it to choose strategies. If you are new to the option chain itself, read our option chain analysis guide first.
What Is Implied Volatility?
Every option price contains a forecast. Implied volatility is that forecast, written as a number. It is the annualised volatility that, when plugged into an option pricing model, gives you the option’s current market price. Nobody sets IV directly. It is implied by what buyers and sellers are willing to pay.
The most common model is Black-Scholes, published by Fischer Black and Myron Scholes in 1973 and extended by Robert Merton. You can read a plain explanation of the Black-Scholes model on Investopedia. The model needs five known inputs and one unknown. Volatility is the unknown, so traders solve for it.
Implied Volatility vs Historical Volatility
Historical volatility, or HV, measures how much price actually moved in the past, usually over 20 or 30 days. Implied volatility measures how much the market expects price to move in the future. HV looks back. IV looks forward.

Notice in the chart that IV usually sits a little above HV. Research across many markets shows the same pattern. Option sellers demand extra premium for taking on the risk of sudden moves. This gap is called the volatility risk premium, and it is one reason disciplined, hedged option selling can work over time.
How Implied Volatility Is Calculated
There is no simple formula that gives IV directly. Instead, a trial-and-error process is used. A computer guesses a volatility, prices the option, compares it with the market price and adjusts the guess until both match. Methods like Newton-Raphson do this in milliseconds.
- Option premium in the market
- Spot price of Nifty or the stock
- Strike price
- Time left to expiry
- Risk-free interest rate
- Dividends, where relevant
You never need to do this by hand. The NSE option chain already shows IV for every strike, and most broker platforms display it next to the premium. What matters is knowing how to read it.
India VIX: Implied Volatility for the Whole Market
India VIX is an index of implied volatility built by NSE from the prices of Nifty options. It shows the market’s expected volatility over the next 30 calendar days, as an annualised percentage. The method is adapted from the CBOE VIX used in the United States. Learn how traders use it in our guide to India VIX and volatility products.
Turning Implied Volatility Into an Expected Move
IV becomes truly useful when you convert it into points. The standard formula for a one standard deviation expected move is simple:
Expected move = Spot price × IV × √(days to expiry ÷ 365)
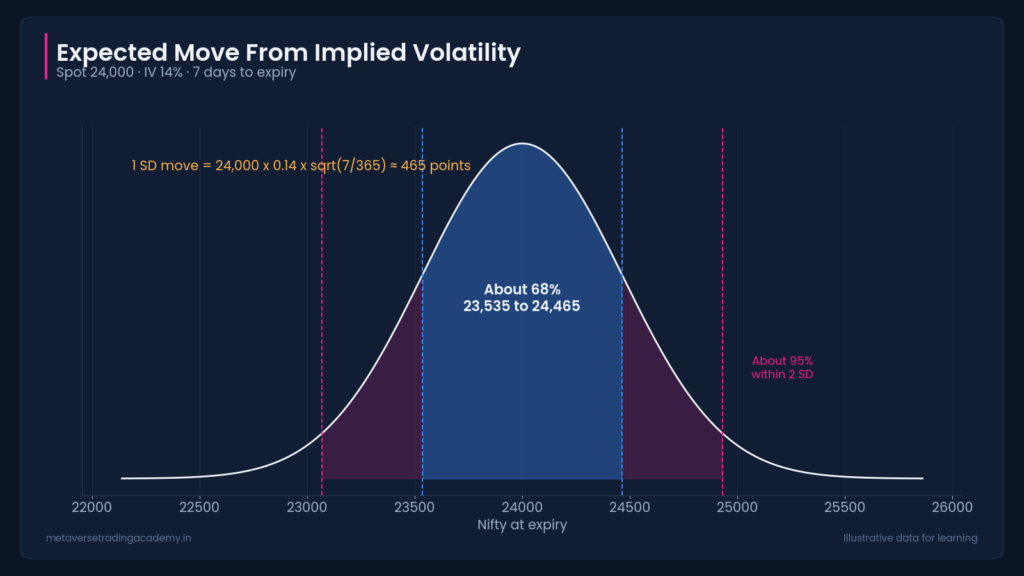
Take Nifty at 24,000 with IV at 14% and seven days to expiry. The expected move is 24,000 × 0.14 × √(7 ÷ 365), which is about 465 points. In theory, there is roughly a 68% chance Nifty stays between 23,535 and 24,465 by expiry, and about a 95% chance it stays within two standard deviations.
The Rule of 16
Here is a quick shortcut professionals use. Divide annual IV by 16 to get the expected daily move. With IV at 16%, the market is pricing roughly a 1% move per day. With IV at 24%, it is pricing about 1.5% per day. The number 16 comes from the square root of about 256 trading days in a year.
Remember that these ranges assume a normal distribution. Real markets have fatter tails. Big gap days happen more often than the bell curve suggests, so always plan for the move that the model says is unlikely.
How to Tell if Implied Volatility Is High or Low
An IV of 18% means nothing on its own. It may be cheap for a volatile stock and expensive for Nifty. You must compare IV with its own history. Two tools do this.

IV Rank
IV rank places today’s IV between the lowest and highest IV of the past 52 weeks. The formula is (current IV minus 52-week low) divided by (52-week high minus 52-week low), times 100. An IV rank of 80 means IV is near the top of its yearly range.
IV Percentile
IV percentile counts how many days in the past year IV was lower than today. An IV percentile of 80 means IV was lower on 80% of days. Percentile is often more reliable than rank, because one extreme spike, like a crash day, can distort the rank for months.
| Reading | IV rank / percentile | What it suggests |
|---|---|---|
| Low | Below 25 | Options are relatively cheap. Buying premium is less costly. |
| Normal | 25 to 75 | No strong edge from volatility alone. |
| High | Above 75 | Options are relatively expensive. Hedged selling may be favoured. |
Vega: How Implied Volatility Moves Option Prices
Vega is the option Greek that measures sensitivity to IV. It tells you how much an option’s premium changes for every one percentage point change in implied volatility. If an option has a vega of 12, a rise in IV from 14% to 15% adds about ₹12 to its price, even if Nifty does not move at all.

- Vega is highest for at-the-money options.
- Vega is higher for options with more time to expiry.
- Vega shrinks as expiry approaches, while gamma grows.
- Buyers are long vega, so they gain when IV rises. Sellers are short vega, so they gain when IV falls.
Gamma and vega work together. As expiry nears, IV matters less and gamma matters more. That is why expiry-day behaviour is driven by dealer hedging, explained in our guide to gamma exposure (GEX).
IV Crush: The Trap That Catches Option Buyers
Implied volatility usually rises before a scheduled event. Traders pay up for options ahead of quarterly results, RBI policy decisions, the Union Budget or election results. Once the news is out, uncertainty disappears and IV collapses. This is called IV crush.

The danger is simple. You can predict the direction correctly and still lose money, because the fall in IV wipes out more premium than the move adds. Before buying options into an event, compare the expected move priced by IV with the move you realistically expect. Our guide to earnings season trading in India shows how results days behave.
Volatility Skew and Term Structure
Implied volatility is not the same at every strike or every expiry. Two patterns matter most.

Volatility Skew
On index options, out-of-the-money puts usually carry higher IV than out-of-the-money calls. Investors pay extra for crash protection, because markets tend to fall faster than they rise. This shape is called the skew or smirk. A steepening skew often signals rising fear even before the index falls. Combine it with the put call ratio for a clearer sentiment read.
Term Structure
Term structure compares IV across expiries. Normally, longer expiries carry slightly higher IV. Before a big event, the near expiry can trade at a higher IV than the next one. This inverted shape tells you exactly where the market expects the risk to land.
How to Use Implied Volatility in Your Trading
IV does not tell you direction. It tells you the price of uncertainty. Use it to choose how to trade, not whether to buy or sell the index. Our comparison of option buying vs option selling explains both sides in detail.
| IV environment | What it means | Approaches traders study |
|---|---|---|
| High IV percentile | Premium is expensive | Defined-risk selling: credit spreads, iron condors |
| Low IV percentile | Premium is cheap | Defined-risk buying: debit spreads, long options before expected expansion |
| IV rising into event | Fear is being priced in | Avoid naked buying into the event, size small |
| IV collapsing after event | Uncertainty is gone | Expect premium decay, avoid paying old prices |
A Simple IV Routine Before the Bell
- Check India VIX and its 52-week range.
- Note ATM IV for the current expiry and the next one.
- Calculate the expected move for the expiry.
- Check skew: are puts getting more expensive than usual?
- Mark any events before expiry that could cause IV crush.
- Only then pick a strategy, with risk defined before entry.
Always size from risk, not conviction. Our guide to risk management in trading explains how, and practising on a demo account first is the safest way to learn how IV affects real premiums.
Common Implied Volatility Mistakes
- Buying options just before an event, then losing to IV crush.
- Calling IV high or low without checking IV rank or percentile.
- Selling options in low IV and getting caught when volatility expands.
- Ignoring skew and assuming all strikes are priced the same way.
- Treating the expected move as a guarantee instead of a probability.
Implied Volatility Inside the CLBS Framework
At Metaverse Trading Academy, IV, skew and the Greeks are part of the professional toolkit in the CLBS V18 framework. IV sets the Context, the expected move helps define the Levels, and the volatility regime guides the Strategy: option buyer, hedged seller, cash or stand down. Every idea then passes through PM-CORE for a final Permission, Restriction or Stand-Down decision. See the full method in the free CLBS V18 brochure.
Want to see IV read live? Explore our trading plans and practise inside the trading room every market day. For further reading, see our list of the best books for option trading.
Frequently Asked Questions
Implied volatility is the level of future volatility that the market is pricing into an option. It is worked backwards from the option's current premium using a pricing model such as Black-Scholes, and it is shown as an annualised percentage. Higher IV means more expensive options.
There is no single good number. IV is only high or low compared with its own history. That is why traders use IV rank and IV percentile, which compare today's IV with the last 52 weeks. For Nifty, the India VIX gives a quick market-wide reference.
IV rank shows where today's IV sits between the 52-week low and high, on a 0 to 100 scale. IV percentile shows the percentage of days in the past year when IV was lower than today. Percentile is less distorted by one extreme spike.
IV has no direct formula. Traders put the option price, spot, strike, time to expiry and interest rate into a pricing model, then adjust the volatility input until the model price matches the market price. Software does this instantly with numerical methods.
India VIX is an index of implied volatility. NSE calculates it from Nifty option prices and it shows the market's expected volatility for the next 30 calendar days. Individual options and strikes still have their own IV, which can differ from India VIX.
IV crush is the sharp fall in implied volatility after a scheduled event such as company results, an RBI policy decision or the Union Budget. Option premiums fall with it, so an option buyer can lose money even when the price moves in the expected direction.
Conclusion
Implied volatility is the price of uncertainty. It tells you how much movement the market expects, how expensive options are and which strategies make sense. Convert IV into an expected move, compare it with its own history using IV rank and percentile, respect vega and IV crush, and watch the skew. Do that, and option prices stop being a mystery.
This article is for education only. It is not investment advice or a trade recommendation. Trading in derivatives involves risk of loss.
Ready to read options like a professional? Visit Metaverse Trading Academy and start learning live today.

Vikas Gahlot
NISM-certified trader, technical analyst, and founder of Metaverse Trading Academy. With more than 10 years of experience in stock market trading and technical analysis, I have trained over 10,000 students across India through online and offline trading programs focused on intraday trading, swing trading, futures & options, and risk management.
More guides by Vikas Gahlot →