Delta and Imbalance Candle Breakout Strategy
The Delta and Imbalance Candle Breakout Strategy combines two of the most powerful concepts in order flow trading: volume delta the real-time difference between aggressive buyers and aggressive sellers and imbalance candles large, wide-bodied candles that signal a sudden shift in market control from one side to the other.
When both align, they create one of the highest-probability breakout setups in trading. In this complete 2026 guide, you will learn exactly what a delta imbalance candle is, how to identify bullish and bearish imbalance candles, how to use volume delta to confirm the breakout direction, and how to trade the setup step by step with real chart examples from Nifty, Forex, and stocks.
There are two different meanings of “Delta” in trading and confusing them leads to wrong decisions.
Options Delta (NOT what this strategy uses): In options trading, Delta measures how much an option’s price changes when the underlying asset moves by ₹1 or $1. A Delta of 0.5 means the option price moves ₹0.50 for every ₹1 move in the stock. This is a different concept entirely.
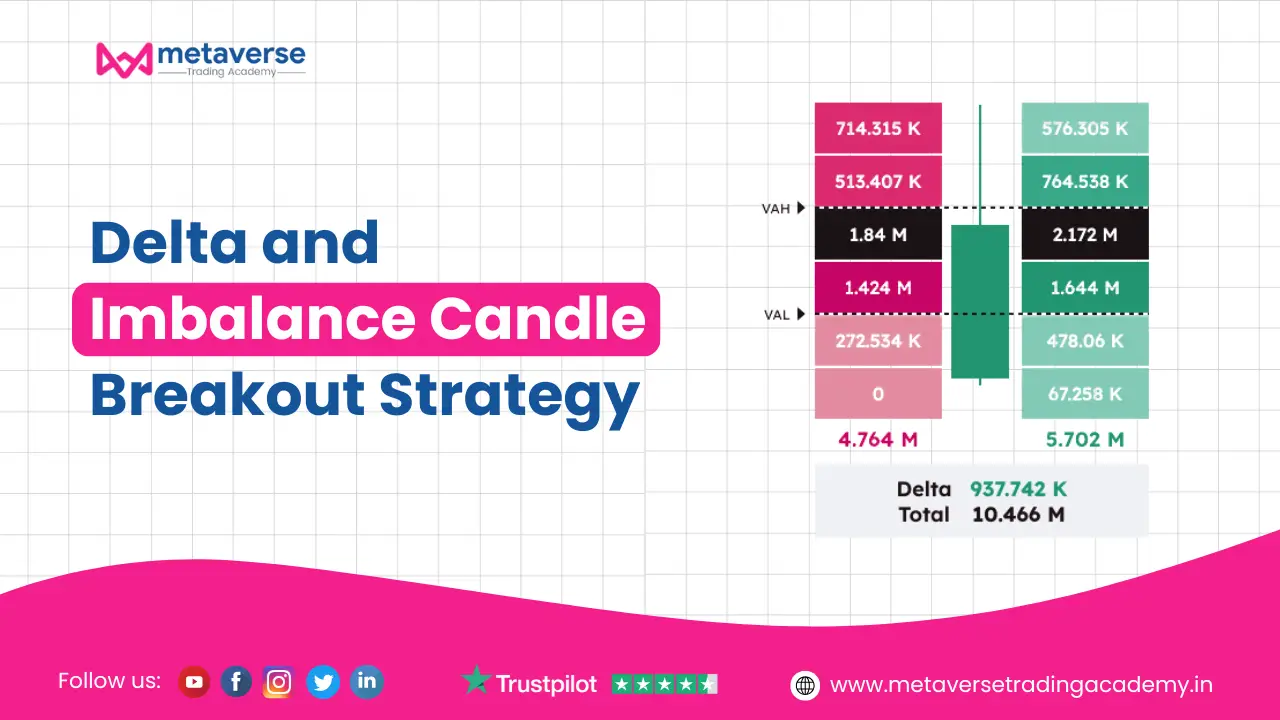
Order Flow Delta (THIS is what this strategy uses): In order flow trading, Delta measures the difference between aggressive buying volume and aggressive selling volume within a specific candle or time period. Delta formula: Delta = Volume bought at Ask (aggressive buyers) − Volume sold at Bid (aggressive sellers)
Positive delta: More aggressive buying than selling buyers in control.
Negative delta: More aggressive selling than buying sellers in control.
Delta spike: A sudden, large positive or negative delta reading. signals institutional activity
Why delta matters for breakout trading: When a price breakout occurs with a large positive delta, it means aggressive buyers are genuinely pushing price higher. the breakout has real conviction. When a breakout occurs with low or negative delta, sellers are absorbing the move. the breakout is likely to fail.
Cumulative Delta: Cumulative Delta tracks the running total of delta across multiple candles. When price makes a new high but cumulative delta does not. that is delta divergence, and it signals the move is weakening. This is one of the most reliable early warning signals in the strategy.
An imbalance candle is a specific candlestick (or group of candles) where the buying or selling pressure is so one-sided that price moves rapidly in one direction, leaving behind a zone of unmatched orders. This is what institutional traders call a “fair value gap” or “order imbalance zone.”
A three-candle imbalance exists when the HIGH of candle 1 does not overlap with the LOW of candle 3 (bullish imbalance), or the LOW of candle 1 does not overlap with the HIGH of candle 3 (bearish imbalance).
Bullish imbalance candle: Candle 2 is a large bullish (green) candle with a long body and minimal wicks The high of candle 1 is BELOW the low of candle 3 The gap between candle 1’s high and candle 3’s low is the imbalance zone Volume on candle 2 must be significantly above average confirms institutional buying
Bearish imbalance candle: Candle 2 is a large bearish (red) candle with a long body and minimal wicks The low of candle 1 is ABOVE the high of candle 3 The gap between candle 1’s low and candle 3’s high is the imbalance zone Volume on candle 2 must be significantly above average confirms institutional selling
Key rule imbalance fill probability: Price fills (returns to) imbalance zones approximately 60–70% of the time. This makes imbalance zones valuable as both entry points (when price returns to fill the gap) and targets (for trades going in the direction of the imbalance). Never assume an imbalance gap will always fill context matters.
An imbalance occurs when the supply and demand of an asset are out of sync, creating pressure in the market. This can often be spotted with a large price spike or a substantial increase in volume. Here’s how to identify it:
Delta shifts represent changes in market sentiment, which often correlate with major price movements. A Delta shift can be detected by analyzing the price momentum in combination with the volume.
Bullish Delta Confirmation: When an imbalance candle forms in an upward direction, check the order flow delta reading for that candle. A strong bullish imbalance candle with a delta of +8,000 to +15,000 contracts (on Nifty futures) or a delta of +70% of total volume (Forex) confirms institutional buying. This is a high-conviction breakout signal.
Bearish Delta Confirmation: A bearish imbalance candle with a delta of −8,000 or more negative contracts signals institutional selling. The more negative the delta on the imbalance candle, the stronger the potential downside move.
Delta Divergence Warning (avoid bad trades): If price makes a new high (bullish imbalance candle forms) but delta is LOWER than the previous move’s delta reading this is delta divergence. It means fewer buyers are participating despite the price breakout. These setups have a high failure rate and should be avoided.
Volume Delta Breakout Candle the premium setup: The highest-quality version of this strategy is when a single candle simultaneously:
When all three align on the same candle, the follow-through probability is significantly higher than any single signal alone.
The breakout candle is crucial for confirming the shift in momentum. It provides a clear entry point for traders. A breakout candle is typically characterized by:
Volume Delta Breakout Candle — The Highest-Conviction Version of This Setup A volume delta breakout candle combines three signals into a single candle, making it the most reliable version of the imbalance breakout strategy. Here is how to identify it.
1. Volume confirmation: The breakout candle’s volume must be at least 2× the 20-candle average volume. On ATAS or Gocharting, this appears as an oversized volume bar beneath the chart. On TradingView, add the Volume indicator and look for the bar that stands clearly above surrounding bars.
2. Delta confirmation: The candle’s delta must be directionally consistent and significantly large. For a bullish volume delta breakout candle: delta must be strongly positive (buying dominating). For a bearish version: strongly negative delta. On ATAS footprint charts, the delta reading appears at the bottom of each candle. On TradingView, use the “Volume Delta” community indicator (search: “Volume Delta” by LazyBear or “Delta Volume” indicators — these show buying vs selling volume per candle as a histogram).
3. Imbalance zone creation: The candle must leave a visible gap between itself and the surrounding candles — the 3-candle imbalance test: high of candle before must not overlap with low of candle after (bullish) or vice versa (bearish).
Trading the volume delta breakout candle — two approaches: Approach A — Breakout entry: Enter on the close of the volume delta breakout candle itself. Stop loss: below the imbalance candle’s low (bullish) or above its high (bearish). Target: next resistance zone or 2× the candle’s range projected from the close.
Approach B — Pullback to imbalance fill: Wait for price to retrace back to the imbalance zone (the gap created by the breakout candle). Enter at the top of the gap zone (bullish imbalance) or bottom of the gap zone (bearish).
Stop loss: just below the bottom of the gap. Target: the high or low created by the original breakout candle, then the next key level. This approach gives a better risk-reward ratio (typically 1:3 to 1:5) but requires patience.
Before executing any trades, it’s important to prepare the market. This includes identifying the major support and resistance levels and watching for news events that could cause sudden imbalances in the market.
After market preparation, the next task is to spot potential imbalance candles. Look for large, body-filled candles that indicate the market’s strong movement in one direction. These candles should be accompanied by an increase in volume, signaling an imbalance between supply and demand.
Once an imbalance is spotted, start observing the Delta. A shift in Delta typically follows an imbalance candle, signaling the potential for a breakout. This shift could indicate a change in the market sentiment, either bullish or bearish.
Before entering a trade, wait for a breakout candle to confirm the breakout direction. This candle should have a clear bullish or bearish trend, with minimal wicks and a strong body.
Once confirmation is achieved, enter the trade by placing a buy or sell order, depending on the direction of the breakout. Always set stop-loss orders to minimize risk in case the market moves against you.
How to See Delta and Imbalance Candles on TradingView, ATAS, and Gocharting TradingView (Free for basic imbalance candle identification): TradingView does not show order flow delta natively, but these community indicators approximate the concept:
1. Search “Fair Value Gap” in the TradingView indicator library this automatically marks imbalance zones (3-candle gaps) on your chart in real time
2. Search “Volume Delta” by LazyBear shows buying vs selling volume per candle as a histogram below your chart
3. Search “Order Flow Imbalance” several versions available; look for one with positive ratings and 1,000+ users How to add: Open TradingView → Pine Script editor (or Indicators tab) → search the name above → click Add to Chart.
ATAS (AT Trading) For professional delta and footprint analysis: ATAS is the gold standard for delta and imbalance candle analysis. On ATAS:
1. Open any chart → right-click → Chart type → Footprint (Bid/Ask) this shows delta per price level within each candle
2. Add the “Cumulative Delta” indicator from the ATAS indicator library
3. Enable “Imbalance” highlighting in footprint settings ATAS will automatically color cells where buying volume is 3× or more than selling volume (or vice versa) within a single candle
4. Connects to Zerodha, Upstox, and Angel One data via third-party bridges for Nifty/BankNifty
Gocharting (Free best for Indian traders): Gocharting has a built-in Delta chart mode:
Zerodha Kite (Standard charts only): Zerodha Kite does not support delta or footprint charts natively. Use Kite for order placement, Gocharting or TradingView for imbalance analysis, and ATAS for professional delta confirmation.
For a detailed walkthrough of the Delta and Imbalance Candle Breakout Strategy, check out our comprehensive video tutorial. This visual guide explains the core principles of the strategy, including how to analyze Delta shifts, spot market imbalances, and confirm breakout candles in real-time trading scenarios.
Delta measures aggressive buying versus selling volume. Positive delta shows buyers dominate; negative delta shows sellers dominate, confirming institutional participation during imbalance candle breakouts.
An imbalance candle is a strong price move creating a gap between candles, showing one-sided buying or selling pressure and unfilled institutional orders.
A three-candle imbalance forms when the middle candle creates a gap between candle one and candle three, defining a bullish or bearish imbalance zone.
No, imbalance gaps fill around 60–70% of the time. Trend-direction imbalances fill less often, while countertrend imbalances usually fill more frequently
Use TradingView’s “Fair Value Gap” indicator for imbalance zones and “Volume Delta” by LazyBear for buying and selling pressure confirmation.
The Delta and Imbalance Candle Breakout Strategy is one of the cleanest, most institutionally-aligned setups available to retail traders. By combining order flow delta confirmation with precise imbalance candle identification and key level context, you remove most of the subjectivity from breakout trading. You are no longer guessing whether a breakout is real you are reading the actual buying and selling pressure that drives it.
For Indian traders using this strategy on Nifty and BankNifty, the approach is especially powerful on expiry days and around key economic announcements when imbalance candles form with the highest delta spikes. Start by marking imbalance zones every evening on the Nifty 15-minute chart, tracking whether price returns to fill them, and using ATAS or Gocharting to confirm delta readings before entry. To go deeper, Metaverse Trading Academy offers live training on delta, imbalance candles, and the complete order flow trading framework.
Over 50,000 students have already learned these strategies. Begin your journey at metaversetradingacademy.in.