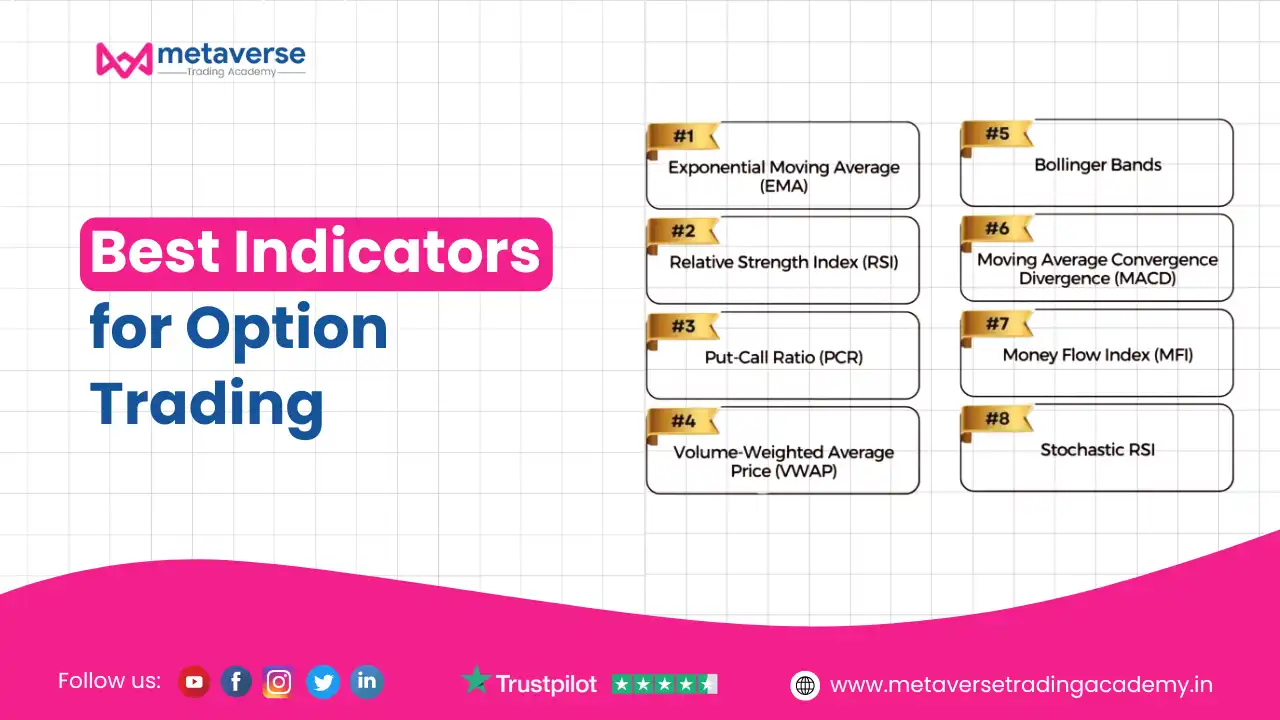
Best Indicators for Option Trading
Option trading has gained immense popularity as a versatile and profitable trading strategy. Unlike traditional stock trading, options offer the flexibility to hedge risks, speculate on market movements, and leverage small investments for substantial returns. However, the dynamic nature of option trading requires precision, and this is where indicators become indispensable.
Indicators are analytical tools that help traders make informed decisions by interpreting market trends, volatility, and momentum. Whether you are a beginner or a seasoned trader, using the right indicators can significantly impact your success in option trading. They not only improve timing but also provide clarity in a market often riddled with uncertainty.
In this guide, we’ll explore the best indicators for option trading to help you refine your strategy. From moving averages to implied volatility, we’ll break down tools that cater to all experience levels. By the end of this article, you’ll understand which indicators suit different trading styles, how to combine them effectively, and when to use them for maximum profitability.
Moving averages are among the most widely used indicators in option trading. They smooth out price data over a specific period, making it easier to identify trends and reversals.
How to Use Moving Averages in Option Trading:
The RSI is a momentum oscillator that measures the speed and change of price movements, ranging from 0 to 100. It’s a popular choice in option trading for identifying overbought or oversold conditions.
Key RSI Levels:
Why RSI Works for Option Trading:
Pro Tip: Combine RSI with other indicators like Bollinger Bands to confirm signals.
Bollinger Bands consist of a moving average and two standard deviation lines, providing a visual representation of price volatility. They’re particularly useful for traders dealing with high-risk, high-reward strategies in option trading.
How to Use Bollinger Bands:
Best for: Straddle or strangle strategies where volatility plays a crucial role.
Implied volatility measures the market’s expectations of future price movements, making it a critical indicator for option trading. High IV suggests significant price swings, while low IV indicates stability.
Why Implied Volatility Matters:
How to Use Implied Volatility:
The Moving Average Convergence Divergence (MACD) indicator is perfect for identifying changes in momentum and trend strength. It consists of two moving averages (fast and slow) and a histogram showing the difference between them.
How to Trade Options Using MACD:
Best For: Swing traders looking to capitalize on medium-term trends.
No single indicator is perfect. Combining multiple indicators helps filter out false signals and improves trading accuracy.
Effective Combinations:
Pro Tip: Avoid overloading your charts with too many indicators. Stick to 2–3 complementary tools for clarity.
Mastering option trading requires not just strategy but also precision in execution. Using indicators like moving averages, RSI, Bollinger Bands, implied volatility, and MACD can provide the clarity needed to navigate the complexities of the options market. These tools help identify trends, gauge momentum, and understand volatility, enabling traders to make informed decisions with confidence.
By combining multiple indicators and practicing disciplined execution, you can refine your trading approach and improve profitability. Remember, no indicator guarantees success, but with consistent application and backtesting, you can significantly enhance your results.
Start exploring these indicators today to see which ones align with your trading goals and style. If you found this guide helpful, share it with fellow traders or leave a comment about your favorite indicator. Let’s grow together as smarter, more successful option traders!
If you want to take your learning further, join Metaverse Trading Academy, where more than 50,000 students have already learned advanced strategies like Order Flow and Market Profile trading. Start your journey today at metaversetradingacademy.in.